AOS-CX switches feature their own analytics engine called the Network Analytics Engine (NAE).
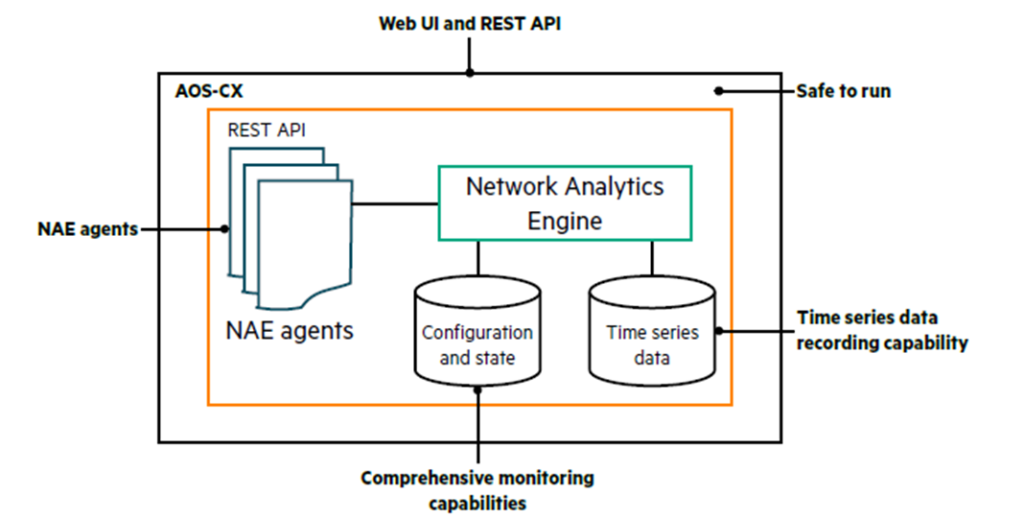
NAE is a unique embedded analytics framework used for network assurance and troubleshooting.
The NAE Agent is provided by HPE Aruba and is essentially a Python script for monitoring switch resources and protocol status.
However, in this post, we will use NAE Lite, a CLI-based framework that requires no knowledge of scripting.
The goal is to define the events you want to monitor, specify the conditions for those events, and briefly describe the actions to be taken when those conditions are met. This feature requires no licenses or additional software and can be used without knowledge of programming languages like Python. You can use these NAE Lite agents to monitor availability, security, and troubleshooting events.
All of the information below is provided by HPE Aruba Networking engineers. Ariya Parsamanesh's Blog contentPlease refer to .
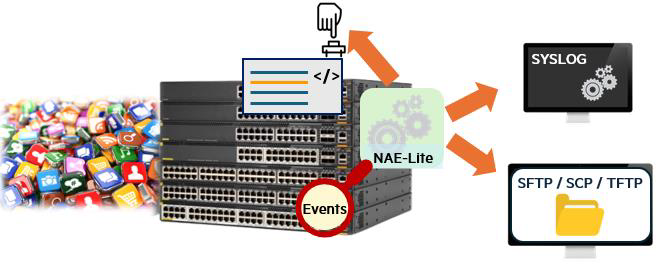
NAE Lite is very flexible and can be used to monitor CPU and memory usage on CX switches.
You can also check for system daemon crash events and collect additional debugging output.
Additionally, it can be used to check for things like the availability of authentication servers, frequent MAC address movements, Spanning Tree changes, BGP and OSPF state changes, VSX and VSF changes, and more. Basically, you can monitor anything that has event/system logs for almost any process.
It is available not only for the 6300/6200 switches, but also for VSX-based CX switches such as the 8XXX series, 6400, and 5420.
How to use NAE Lite
AOS-CX switches support over 7000 event IDs that can be monitored.
All events are HPE Networking Support Portal (NSP)This is documented in the Event Log Message Reference Guide, which can be downloaded from .
Here Event Log Reference Guide for AOS-CX 10.15I am using .
First of all, NAE lite consists of the following three parts:.
- Events you want to monitor
- Some conditions that must be met
- Action to perform when the condition is met
You can configure the NAE Lite agent to monitor the events listed in the Event Log Message Reference Guide.
Here is a list of some events that might be of interest:.
- Unable to connect to Radius server (all servers).
- IPSLA, icmp-echo, and https-server
- Deleted static route
- Interface flap
- Change routing status
- Spanning-Tree Events and Topology Changes
And the tasks that can be executed based on given conditions are as follows (see the guide document for each example):
- Generate SYSLOG messages and send them to the SYSLOG server
- Customizing the functionality and severity of SYSLOG messages
- Execute multiple CLI commands
- Redirect the output of CLI commands to a TFTP server or a local file on flash.
- Create custom SNMP traps and send them to an SNMP server.
- Execute a configured task CLI command at a specific time (scheduling a task)
The CX 6200 switch supports up to 10 NAE or NAE-Lite agents.
You should check the maximum supported agents for each switch model in advance.
– Go to the AOS-CX Feature Navigator
Now, let's look at two use cases to see how we can automate this with NAE-lite.
1. LACP monitoring
Let's check the status changes of some interfaces in the LACP LAG (Link Aggreagation Group).
“Event Log Message Reference Guide”There is a section on LACP that lists all the LACP events that can be generated.
Here we will use Event ID: 1321. This event is generated when the LACP state changes.
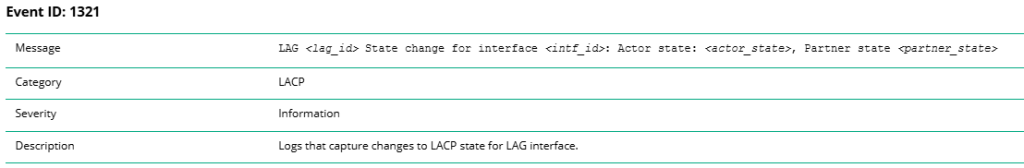
Before you start creating the NAE-lite agent, you should check the generated Event ID: 1321 message to get a more accurate idea.
You have configured the switch to send SYSLOG messages to a SYSLOG server.
When I connected another CX switch to the LACP interface, the following three events were generated:.

Here ALFNCDIf this flag is displayed, it means one of the LACP interfaces is up. The event also mentions "Actor State" and "Partner State," which we'll utilize. Finally, if the flag is ALFO, it means one of the LACP interfaces is down.
Okay, let's configure it like the example below. The IP address of the SYSLOG server is 192.168.1.100no see.
nae-agent lite lacp_interface_watch_agent watch lacp_DOWN event-log 1321 watch lacp_UP event-log 1321 set-condition watch event-log lacp_DOWN include any "Actor state: ALFO","Partner state ALFO" status critical syslog "LACP Interface is down" cli show lacp interfaces clear-condition watch event-log lacp_UP include all "Actor state: ALFNCD","Partner state ALFNCD" syslog "LACP Interface is up" cli show interface lag256 brief\n show lacp interfaces ! nae-agent lite lacp_interface_watch_agent activate ! Login 192.168.1.100 !This NAE-lite agent works as follows:.
- Agent has the status of LACP in SYSLOG Event ID:1321, “lacp-DOWN”"and "“lacp-UP”" is being monitored.
- Next, we configure a condition to indicate when the LACP interface is down.
Within the event content The following two phrases:“Actor state: ALFO”, “Partner state ALFO”" It just has to match one of them. - When this condition is met, a critical syslog message is sent stating “LACP interface is down”.
And the CLI command “sh lacp interfaces”" is run. - Then we configure a condition that indicates when the previously downed interface has been restored.
Check if there is an event 1321 message, but this time there are two conditions: “Actor state: ALFNCD“"and "“Partner state ALFNCD“Both conditions are metMust do. - Then run two CLI commands:.
- Finally, activate the NAE-lite agent.
Agent Testing
As always, before you begin testing, you need to establish a baseline.
The current status of the LACP interface is as follows:.
6200(config)# show lacp interfaces

State abbreviations: A - Active P - Passive F - Aggregable I - Individual S - Short-timeout L - Long-timeout N - InSync O - OutofSync C - Collecting D - Distributing X - State m/c expired E - Default neighbor state

Actor details of all interfaces: ---------------------------------------------------------------------------------- Intf Aggr Port Port State System-ID System Aggr Forwarding Name Id Pri Pri Key State ----------------------------------------------------------------------------------
1/1/13 	lag256 14 1 	ALFNCD 	94:60:d5:da:5a:20 65534 256 	up
1/1/14 	lag256 15 1 	ALFNCD 	94:60:d5:da:5a:20 65534 256 	up

Partner details of all interfaces: ---------------------------------------------------------------------------------- Intf Aggr Port Port State System-ID System Aggr Name Id Pri Pri Key ----------------------------------------------------------------------------------
1/1/13 	lag256 14 1 	ALFNCD 	ec:67:94:d4:79:c0 65534 256
1/1/14 	lag256 15 1 	ALFNCD 	ec:67:94:d4:79:c0 65534 256
Check the NAE-Lite agent you just configured.
6200(config)# sh nae-agent lacp_interface_watch_agent
Script Name : lacp_interface_watch_agent Version : 1.0 Origin : generated Disabled : false Status : NORMAL Time Series Count : 0 Alerts Count : 0 Rules : 0 Error : NONE Alert Description : NONE Recent alerts :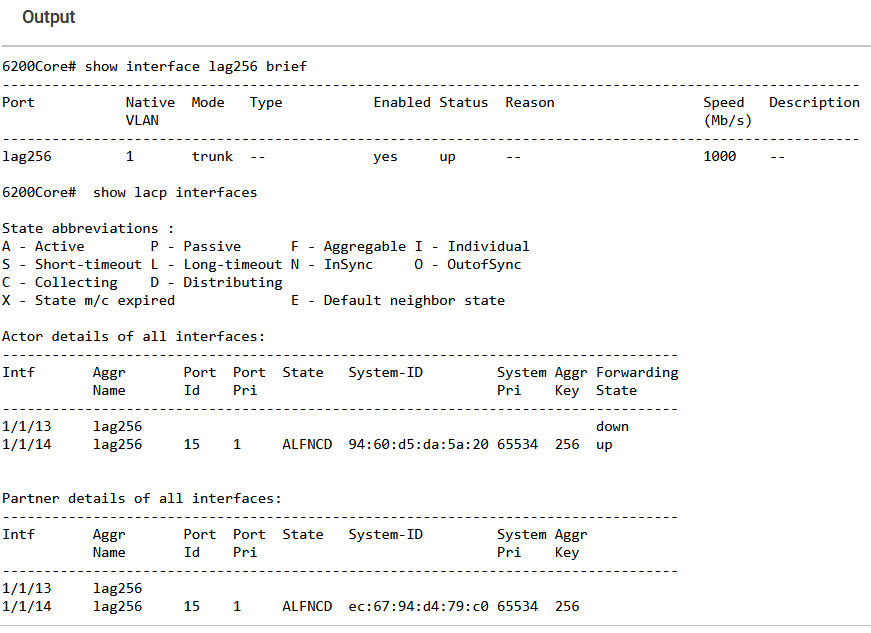
No alerts found “show interface lag256 brief”You can check the LAG interface status and LACP Speed through the " command.
The LAG interface, called lag256, consists of two 1GbE interfaces.
6200(config)# show interface lag256 brief
-------------------------------------------------------------------------------------- Port Native Mode Type Enabled Status Reason Speed Description VLAN (Mb/s) ---------------------------------------------------------------------- lag256 1 trunk -- yes up -- 	2000 	--
Now that we have our baseline set, let's use LACP to disconnect one of the interfaces that is part of lag256.
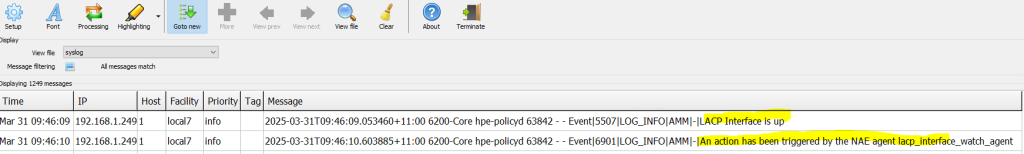
This will generate a SYSLOG message like the following and send it to my SYSLOG server:.
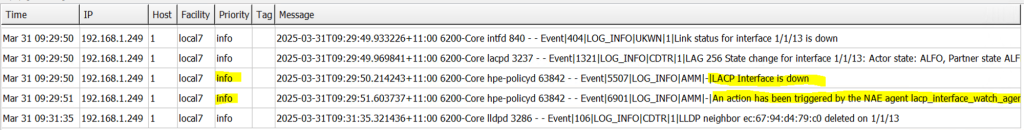
The first message highlighted here is the message sent by the NAE agent.
“LACP Interface is down”
under show You can check NAE-lite agent notifications with the command:.
6200(config)# sh nae-agent lacp_interface_watch_agent alerts
<1> 2025-03-31 09:29:50 An action has been triggered by NAE agent lacp_interface_watch_agent
If you want to see the details of the alert and the output of the CLI command that is part of the Nae-Lite agent, details Add a command.
6200(config)# sh nae-agent lacp_interface_watch_agent alerts details

Alert message : 2025-03-31 09:29:50 An action has been triggered by NAE agent lacp_interface_watch_agent Action(s) Performed : Alert(1), Syslog(1), CLI(1) Action Details ===================== Action Alert : Alert Level Changed to CRITICAL
Action Syslog : [local] LACP Interface is down Action CLI : <1> CLI command(s) --------------------- show lacp interfaces --------------------- Output --------------------- 6200Core# show lacp interfaces State abbreviations : A - Active P - Passive F - Aggregable I - Individual S - Short-timeout L - Long-timeout N - InSync O - OutofSync C - Collecting D - Distributing X - State m/c expired E - Default neighbor state Actor details of all interfaces: ---------------------------------------------------------------------------------- Intf Aggr Port Port State System-ID System Aggr Forwarding Name Id Pri Pri Key State ----------------------------------------------------------------------------------
1/1/13 	lag256 								down
1/1/14 lag256 15 1 ALFNCD 94:60:d5:da:5a:20 65534 256 up Partner details of all interfaces: ---------------------------------------------------------------------------------- Intf Aggr Port Port State System-ID System Aggr Name Id Pri Pri Key ---------------------------------------------------------------------------------- 1/1/13 lag256 1/1/14 lag256 15 1 ALFNCD ec:67:94:d4:79:c0 65534 256 --------------------- Only the action Alert, action Syslog, and action CLI details are displayed in this command. Please refer to the Web UI for other action details.
The agent worked as expected.
Next, reconnect the Down interface and the LACP interface will appear.
The log below is a message received from the SYSLOG server.
Now you can check the second alarm.
6200(config)# sh nae-agent lacp_interface_watch_agent alerts

<1> 2025-03-31 09:46:09 An action has been triggered by NAE agent lacp_interface_watch_agent <2> 2025-03-31 09:29:50 An action has been triggered by NAE agent lacp_interface_watch_agent
Let's take a closer look. Here are the details of the latest alarm.
6200(config)# sh nae-agent lacp_interface_watch_agent alerts details 1 Alert message : 2025-03-31 09:46:09 An action has been triggered by NAE agent lacp_interface_watch_agent Action(s) Performed : Alert(1), Syslog(1), CLI(1) Action Details ===================== Action Alert : Alert Level Changed to None Action Syslog : [local] LACP Interface is up Action CLI: <1> CLI command(s) --------------------- show interface lag256 show lacp interfaces --------------------- Output --------------------- 6200# show interface lag256 Aggregate lag256 is up Admin state is up Description : MAC Address : 94:60:d5:da:5a:20 Aggregated-interfaces : 1/1/13 1/1/14 Aggregation-key : 256 Aggregate mode : active Speed : 2000 Mb/s qos trust none VLAN Mode: native-untagged Native VLAN: 1 Allowed VLAN List: 1,5,10-13,16,20,100,110,120,130,140,150,160,192 L3 Counters: Rx Disabled, Tx Disabled Statistic RX TX Total ---------------- -------------------- -------------------- -------------------- Packets 1661 21681 23342 Unicast 1178 14 1192 Multicast 376 4176 4552 Broadcast 107 17491 17598 Bytes 200292 2757079 2957371 Jumbos 0 0 0 Dropped 0 0 0 Pause Frames 0 0 0 Errors 0 0 0 CRC/FCS 0 n/a 0 Collision n/a 0 0 Runts 0 n/a 0 Giants 0 n/a 0 6200# show lacp interfaces State abbreviations : A - Active P - Passive F - Aggregable I - Individual S - Short-timeout L - Long-timeout N - InSync O - OutofSync C - Collecting D - Distributing X - State m/c expired E - Default neighbor state Actor details of all interfaces: ---------------------------------------------------------------------------------- Intf Aggr Port Port State System-ID System Aggr Forwarding Name Id Pri Pri Key State ---------------------------------------------------------------------------------- 1/1/13 lag256 14 1 ALFNCD 94:60:d5:da:5a:20 65534 256 up 1/1/14 lag256 15 1 ALFNCD 94:60:d5:da:5a:20 65534 256 up Partner details of all interfaces: ---------------------------------------------------------------------------------- Intf Aggr Port Port State System-ID System Aggr Name Id Pri Pri Key ---------------------------------------------------------------------------------- 1/1/13 lag256 14 1 ALFNCD ec:67:94:d4:79:c0 65534 256 1/1/14 lag256 15 1 ALFNCD ec:67:94:d4:79:c0 65534 256 --------------------- Only the action Alert, action Syslog, and action CLI details are displayed in this command. Please refer to the Web UI for other action details. As expected, it worked fine, and this time two CLI commands were executed.
Between two CLI commands “\n”Note that we used as a delimiter.
If you check the SYSLOG server, you can see that the severity of the SYSLOG message sent by the agent is “Info” as shown below.
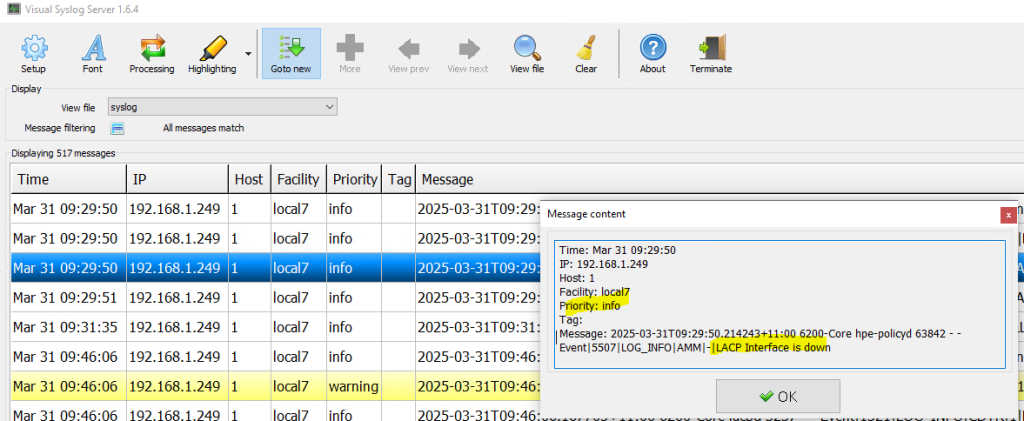
We want to change this severity to “Critical” so that we can easily see the events on the SYSLOG server.
To do this, we will modify the agent and add Severity related commands.
nae-agent lite lacp_interface_watch_agent watch lacp_DOWN event-log 1321 watch lacp_UP event-log 1321 set-condition watch event-log lacp_DOWN include any "Actor state: ALFO","Partner state ALFO" status critical syslog "LACP Interface is down" severity crit cli show lacp interfaces clear-condition watch event-log lacp_UP include all "Actor state: ALFNCD","Partner state ALFNCD" syslog "LACP Interface is up" cli show interface lag256 brief\n show lacp interfaces Please note that if you change an already activated NAE agent, you will need to re-activate it for the changes to take effect.
Here's how:.
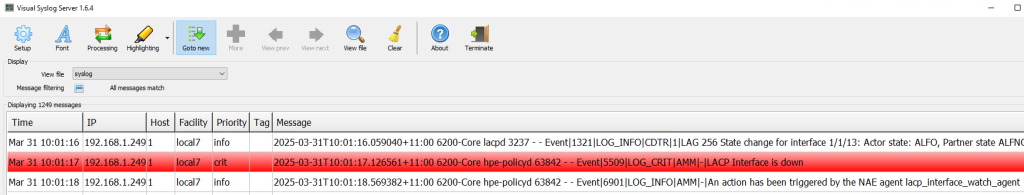
6200(config)# no nae-agent lite lacp_interface_watch_agent activate
6200(config)# nae-agent lite lacp_interface_watch_agent activate
Now, if I unplug one of the LACP interfaces again, a system log with severity Critical is generated, marked in red, as shown below.
2. Offline backup of switch configuration information
Next, let's configure the switch to send a copy of the configuration file to a TFTP server, along with an audit trail of the last 20 commands executed on the switch when the switch's configuration is saved. The audit trail log allows you to track changes and who performed them.
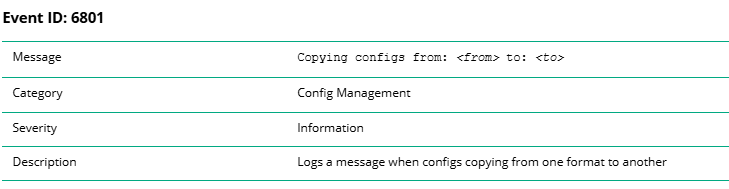
Here we will use Event ID 6801 to generate the following SYSLOG message:.
Basically the event below is “write memory” is generated when you run it.
Event|6801|LOG_INFO|AMM|-|Copying configs from: running-config to: startup-configHere is the NAE-lite agent:.
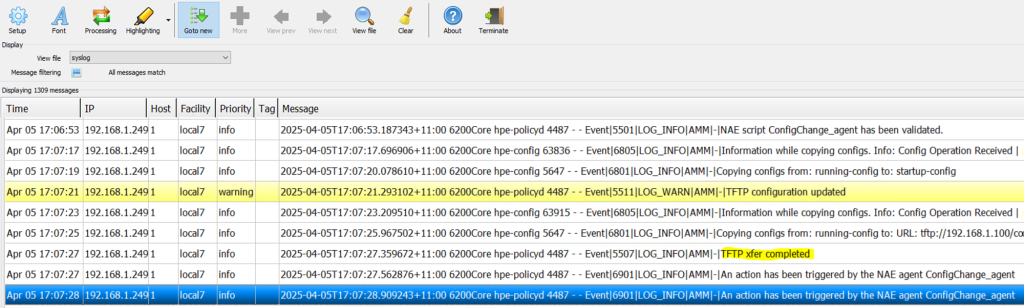
nae-agent lite ConfigChange_agent watch config_change event-log 6801 watch tftp_transfer event-log 6801 set-condition watch event-log config_change include any "Copying configs from: running-config" status minor syslog " TFTP configuration updated " severity warning cli copy running-config tftp://192.168.1.100/confign-core.txt cli\n clear-condition watch event-log tftp_transfer include any "URL: tftp:" syslog " TFTP xfer completed " cli show accounting log last 20 | redirect tftp://192.168.1.100/acctlog.txtNow let's activate the agent and check all the NAE-lite agents we have configured so far.
6200(config)# nae-agent lite ConfigChange_agent activate
6200(config)# show nae-agent
------------------------------------------------------------------------------------------------------------------------------------------------------ Agent Name Script Name Version Origin Disabled Status Time Series Count Alerts Count Rules Error ---------------------------------------------------------------------------- ConfigChange_agent ConfigChange_agent 1.0 generated false NORMAL 0 0 0 NONE interface_watch_agent interface_watch_agent 1.0 generated false NORMAL 0 4 0 NONE lacp_interface_watch_agent lacp_interface_watch_agent 1.0 generated false CRITICAL 0 1 0 NONE system_resource_monitor.default system_resource_monitor 1.5 system false NORMAL 10 0 6 NONE
Agent Testing
Let's delete NAE-data using the command below.
6200(config)# clear nae-data
This action will delete NAE data monitored so far. Do you want to continue (y/n)? y

6200(config)#
Let's check the agent we just configured.
6200(config)# sh nae-agent ConfigChange_agent
Script Name : ConfigChange_agent Version : 1.0 Origin : generated Disabled : false Status : NORMAL Time Series Count : 0 Alerts Count : 2 Rules : 0 Error : NONE Alert Description : NONE Recent alerts :
	No alerts found
You are now ready to test the new NAE-lite agent.
“After executing the ”write memory” command, let’s check the SYSLOG server and TFTP server.
6200(config)# show nae-agent ConfigChange_agent
Script Name : ConfigChange_agent Version : 1.0 Origin : generated Disabled : false Status : NORMAL Time Series Count : 0 Alerts Count : 2 Rules : 0 Error : NONE Alert Description : NONE Recent alerts :
	<1> 2025-04-05 17:07:27 An action has been triggered by NAE agent ConfigChange_agent
	<2> 2025-04-05 17:07:21 An action has been triggered by NAE agent ConfigChange_agent
There are two alarms, so let's check the details.
The #2 alarm is a warning for configuration changes triggered by “write memory,” which is the operation to copy configuration information to the TFTP server.
6200(config)# show nae-agent ConfigChange_agent alerts details 2 Alert message : 2025-04-05 17:07:21 An action has been triggered by NAE agent ConfigChange_agent Action(s) Performed : Alert(1), Syslog(1), CLI(1) Action Details ===================== Action Alert : Alert Level Changed to MINOR Action Syslog: [local] TFTP configuration updated Action CLI: <1> CLI command(s) --------------------- copy running-config tftp://192.168.1.100/confign-core.txt cli --------------------- Output --------------------- 6200# copy running-config tftp://192.168.1.100/ confign-core.txt cli Copying configuration: [Success] 6200# --------------------- Only the action Alert, action Syslog, and action CLI details are displayed in this command. Please refer to the Web UI for other action details.The #1 alarm is for the clear condition of this watch event.
So basically this condition is triggered when the configuration copy to the TFTP server is successfully completed.
Here we use the SYSLOG message “TFTP xfer completed” and the CLI operation.
6200(config)# show nae-agent ConfigChange_agent alerts details 1 Alert message : 2025-04-05 17:07:27 An action has been triggered by NAE agent ConfigChange_agent Action(s) Performed : Alert(1), Syslog(1), CLI(1) Action Details ===================== Action Alert : Alert Level Changed to None Action Syslog: [local] TFTP xfer completed Action CLI: <1> CLI command(s) --------------------- show accounting log last 20 | redirect tftp://192.168.1.100/acctlog.txt --------------------- Output --------------------- 6200# show accounting log last 20 | redirect tftp://192.168.1.100/acctlog.txt --------------------- Only the action Alert, action Syslog, and action CLI details are displayed in this command. Please refer to the Web UI for other action details.The SYSLOG server displays the SYSLOG message “TFTP configuration has been updated” with severity = Warning.
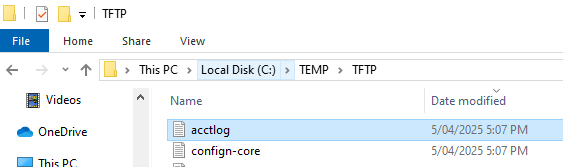
You can also check the transferred files on the TFTP server.
Check on the Switch Dashboard
In addition to the CLI, you can also check the status of the NAE-Lite agent using the Web UI of the CX switch.
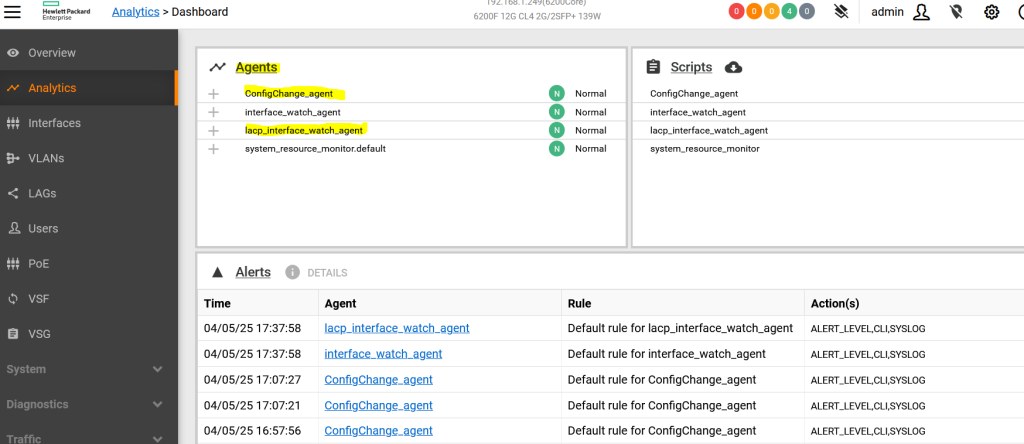
There are 4 agents running here.
One of them is the system default “system_resource_monitor” and the other is a newly created NAE-lite agent.
Let's click on the LACP agent.
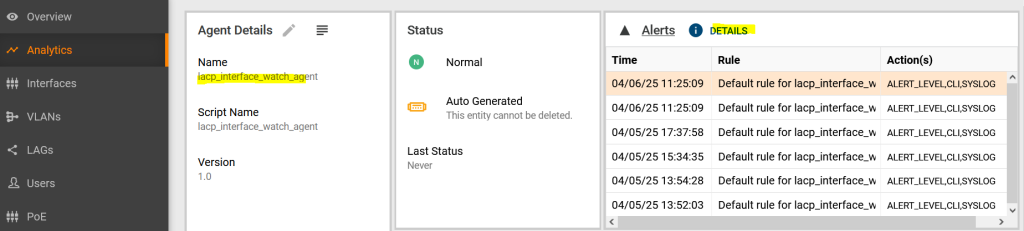
You can see that there have been recent alarms. Click “details” to see them.
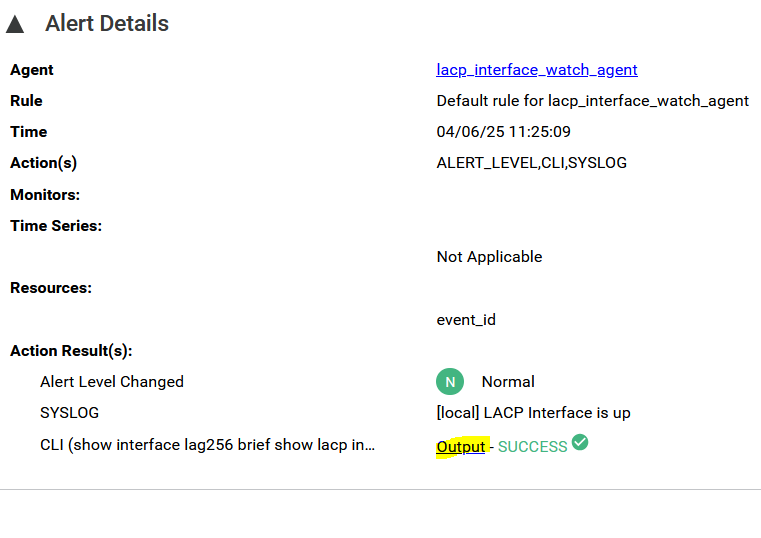
If you click Output on the last line, you can see the CLI command output as below.
NAE Lite and Aruba Central
The same applies if you have switches managed through HPE Aruba Networking Central.
You can view notifications and event details for NAE lite agents in Central.
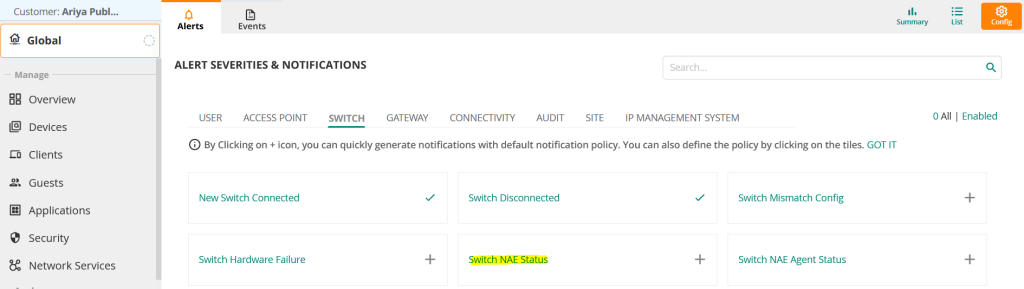
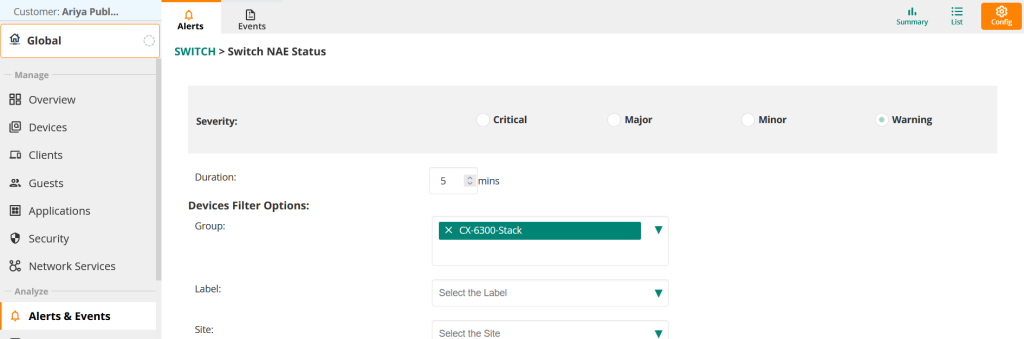
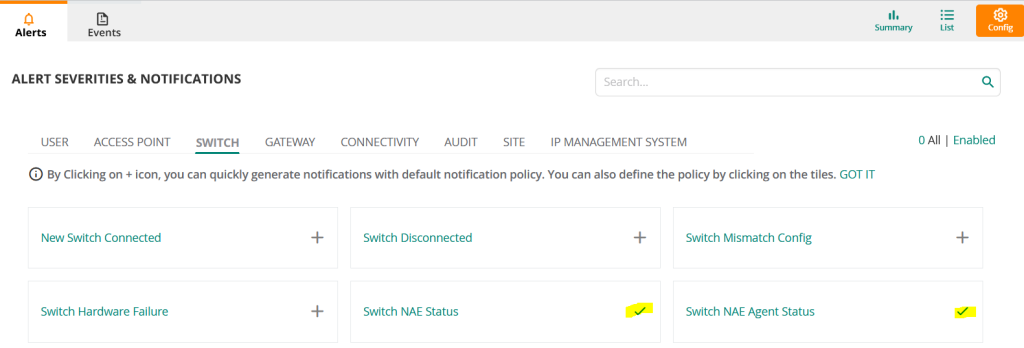
NAE status notifications are disabled by default, so let's enable them. Go to "Switch NAE Status.".
Now select the desired Severity Level and enable it for the required group/site/device.
“Set ”Switch NAE Agent Status” the same way.
Once this is done, you can view the NAE status in Classic Central at the group/global level by selecting the NAE Status column as shown below.
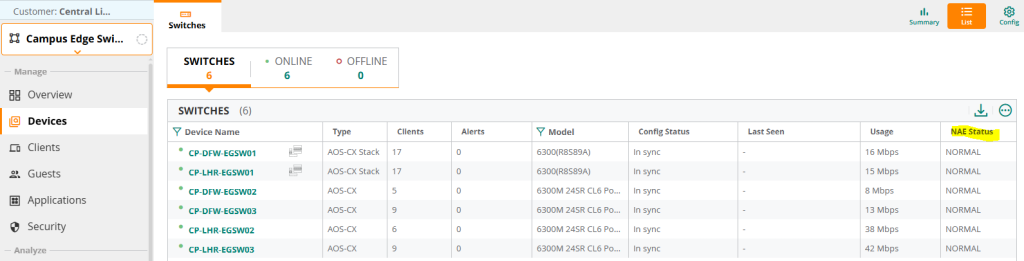
When an NAE Lite agent generates an event, it should be visible in two places:.
First, you can check using the NAE Status column in the group context as shown in the figure below.
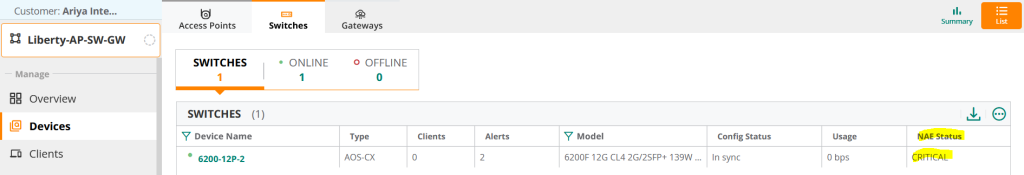
The reason it is marked as Critical in the screenshot above is because we changed the severity of the NAE lite agent to Critical.
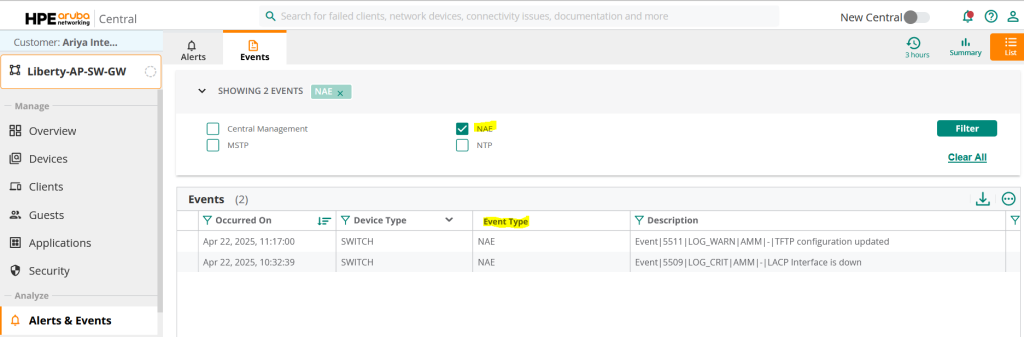
The second is where you can filter NAEs in events to see only those notifications.
Here you can see two events generated for the NAE Lite script.
You can also see NAE listed as one of the high severity alerts in the Alerts section of the NOC screen in New Central.
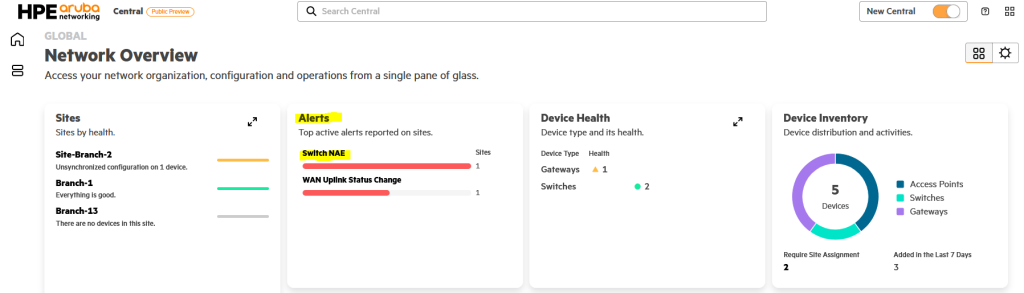
When you click “Switch NAE” here, you will see the following screen:,
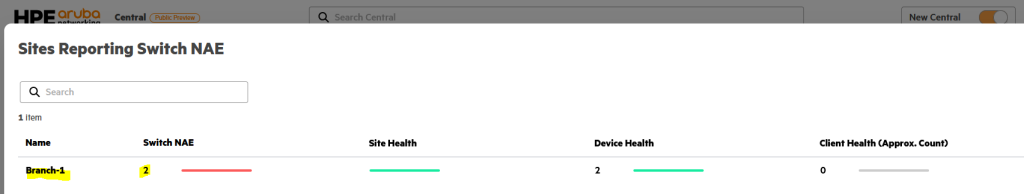
You can click Branch1 here to go to that site.
This is especially useful if you have several sites. This allows you to quickly check alerts based on severity across all sites.
“If you click on “Branch-1” you will see that there are two NAE notifications.
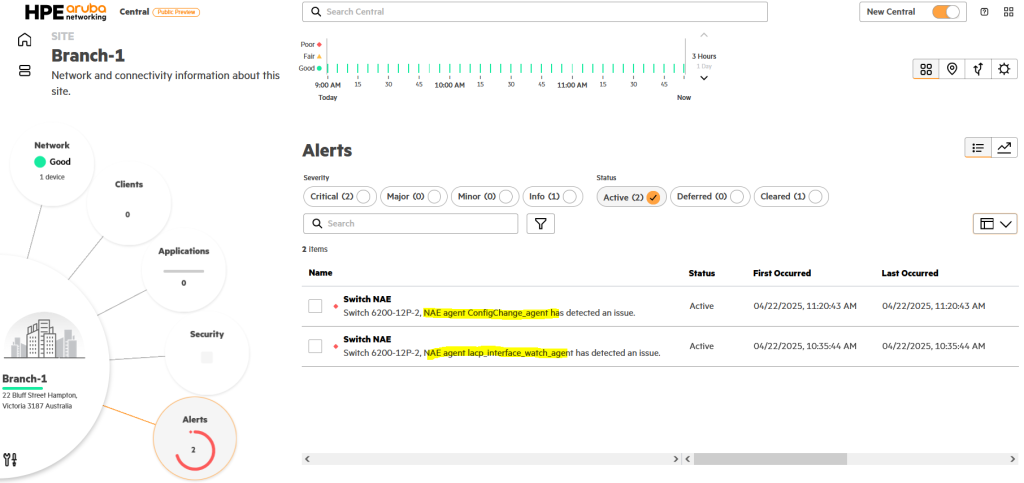
This is because we configured and tested two NAE Lite scripts. The name of the agent that generated the alert is also displayed.
There are many ways to automate the operation of network devices.
You can either write a Python script or use an automation framework like Ansible.
Alternatively, you may be able to utilize NAPALM or similar.
It is very convenient to remotely manage multiple switch devices by leveraging this automation.
However, this has the disadvantage that the operator must have a precise understanding of the script.
The AOS-CX switch operating system helps anyone easily automate operations through an analysis engine called NAE.
Anyone can create and configure an agent as long as they have an idea of what actions to take under what conditions.
Scripts for the NAE agent (not the CLI-based NAE lite) can be found on Github below.
https://github.com/aruba/nae-scripts/tree/master