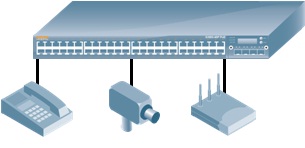
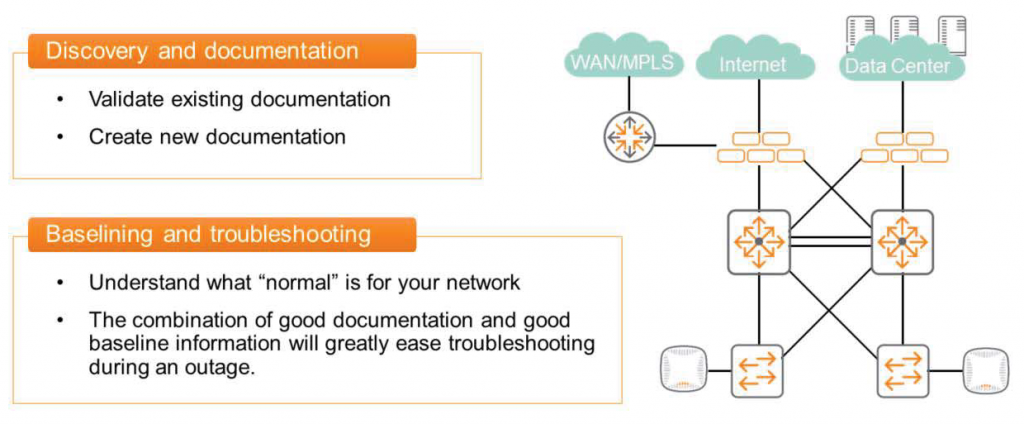
In today's post, we'll explore the general functions of networking equipment, along with some very basic commands that can help you identify them. This information is crucial for learning during the entry-level process, as future network engineers and administrators will need to be proficient in identifying the true nature of network connections. This knowledge will help you verify existing documentation or create documentation for new networks.
such “show” commandIt is also useful for setting benchmarks and troubleshooting.
This command allows you to view many switch performance and status parameters, including CPU and memory utilization.
Can you give me an example?
Let's say your network is healthy and there are no issues, and all switches are typically showing CPU utilization of approximately 5%. You know your network well and have been paying attention to this issue for several months. Then, you notice that one switch is showing utilization of 85% during a failure or slowdown. You might want to focus on that switch or check other devices connected to it.
This is likely because we were constantly monitoring the network when it was operating normally. If we hadn't been paying attention and didn't know the status of the switches on the network, we wouldn't have been able to tell whether the 85%'s utilization was normal or abnormal.
Of course, Aruba has a very effective management platform that can easily automate these basic processes, but it is still important to check the status of network devices using the CLI.
Mastering switch commands and understanding baseline states is crucial for network operation. This isn't just for exams; when you're faced with the realities of operating and managing network equipment, especially when a failure occurs, you'll realize how effective all of this knowledge will be later on.
So, let's take a look at some of the main "Show" commands.
Show version
“show version”This command displays version information about the switch operating system. It also displays information about the service operating system and BIOS version in addition to the switch operating system.
Switch# show version
---------------------------------------------------------------------
AOS-CX
(c)Copyright 2017-2019 Hewlett Packard Enterprise Development LP -------------------------------------------------------------------------------- Version: GL.10.04.003
Service OS Version: GL.01.05.0002 BIOS Version: GL-01-0013
Command Context is available to both Operator(>) and Manager(#), and permissions are available to both Operators and Administrators.
Show system
“show system” This command displays general status information about the system. If connected remotely (e.g., via TELNET or SSH), the device platform or version information may not be accurate.
Below is information for a CX switch with the model number Aruba 8325-48YC and the hostname Switch.
Switch# show system Hostname : Switch System Description : GL.10.04.003 System Contact : System Location : Vendor : Aruba Product Name : JL635A Aruba 8325-48Y8C 48p 25G 8p 100G Swch Chassis Serial Nbr : TW98KM003P Base MAC Address : 9020c2-bced00 AOS-CX Version : GL.10.04.0003 Time Zone : UTC Up Time : 1 week, 1 day, 11 hours, 20 minutes CPU Util (%) : 4 Memory Usage (%) :19Here you can check serial information, MAC address, operating time, and even CPU and memory usage.
Based on this information, we can determine the reference point of the switch, and when this value changes significantly, we can assess the abnormal state of the switch.
Show running-config
“show running-config”Displays configuration information applied to the switch. User information is not displayed. It is only available in Manager Context (#) mode and requires Administrator privileges.
Switch# show running-config
Current configuration: ! !Version AOS-CX GL.10.04.0003 !export-password:default Hostname Switch ! Router ospf 1 area 0.0.0.0 Vlan 1,1101,1103,1105,1107 Interface mgmt no shutdown ip static 10.250.1.3/24 default-gateway 10.250.1.254 Interface 1/1/29 no shutdown description To-8325-Core-Table01-Port47 no routing Vlan trunk native 1 Vlan trunk allowed 1101,1103,1105
<< >>
Top CPU
This command displays detailed CPU usage information. We previously demonstrated how the "show system" command can be used to check CPU usage. However, the "Top CPU" command provides even more detailed information.
It is available in both Operator(>) and Manager(#) modes, and can be used by users with Operator or Administrator privileges.
Switch# top cpu
top - 20:40:46 up 17 days, 23:45, 1 user, load average: 0.32, 0.26, 0.24 Tasks: 238 total, 1 running, 194 sleeping, 0 stopped, 0 zombie %Cpu(s): 2.5 us, 1.6 sy, 0.0 ni, 95.9 id, 0.0 wa, 0.0 hi, 0.0 si, 0.0 st KiB Mem: 7868164 total, 3013360 free, 13999328 used, 3455476 buff/cache KiB Swqp: 2097148 total, 2095868 free, 1280 used, 6079420 avail Mem PID USER PR NT VIRT RES SHR S %CPU %MEM TIME+ COMMAND 26308 admin 20 0 3344 2064 1612 R 11.8 0.0 0:00.03 top -b -nl -s -c -o %CPU 629 root 20 0 33928 17084 6124 S 5.9 0.2 777:57.14 /usr/sbin/ovsdb-server 3047 root 20 0 791184 84416 32232 S 5.9 1.1 189:43.13 /usr/bin/prometheus 1 root 20 0 7600 6312 2960 S 0.0 0.1 0:28.14 /usr/sbin/init
Top Memory
This command, like “Top CPU”, will also show information about memory usage.
It is available in both Operator(>) and Manager(#) modes, and can be used by users with Operator and Administrator privileges.
Switch# top memory
top - 20:41:22 up 17 days, 23:46, 1 user, load average 0.31, 0.26, 0.24 Tasks: 238 total, 2 running, 193 sleeping, 0 stopped, 0 zombie %Cpu(s): 2.5 us, 1.6 sy, 0.0 ni, 95.9 id, 0.0 wa, 0.0 hi, 0.0 si, 0.0 st KiB Mem: 7868164 total, 3013768 free, 1398760 used, 3455636 buff/cache KiB Swqp: 2097148 total, 2095868 free, 1280 used, 6080024 avail Mem PID USER PR NT VIRT RES SHR S %CPU %MEM TIME+ COMMAND 2366 root 20 0 2013036 129684 45568 S 0.0 1.6 739:59.05 /usr/bin/switchd_agent -il -s 3047 root 20 0 791184 84416 32232 S 5.9 1.1 189:43.37 /usr/bin/prometheus -- 701 root 20 0 1212616 75652 19316 S 0.0 1.0 18:02.19 /usr/bin/hpe-restd
Show interfaces brief
This command displays the current status along with information about available interfaces.
It will also show Layer 2 and Layer 3 configuration information applied to the interface.
This is a command that many network engineers frequently use. While it's used to check the status of all interfaces on a device, it's also used to focus on specific information, such as the Enabled or Status columns.
Switch# show interface brief
------------------------------------------------------------------------------ Port Native Mode Type Enabled Status Reason Speed VLAN (Mb/s) ------------------------------------------------------------------------------ 1/1/1 1 routed SFP28DAC3 yes up 25000 1/1/2 1 trunk SFP28DAC3 yes up 25000 1/1/3 1 trunk SFP28DAC3 yes up 25000
<< >>
If the Enabled entry says "yes," it means it's not disabled in the switch configuration. If the Status entry says "up," it means a device is connected to the interface. This means that at least Layer 1/Layer 2 communication is taking place between the two.
This command is also available in both Operator(>) and Manager(#) modes, and can be used by users with Operator or Administrator privileges.
Show interfaces transceiver details
This command displays information about the transceivers mounted on the interface.
- Command context: Operator(>) or Manager(#)
- Authority: Operator or Administrator
Switch# show interface transceiver details
Transceiver in 1/1/1 Interface Name : 1/1/1 Type : SFP28DAC3 Connector Type : No separable connector Transfer Distance : 0.00km (SMF), 0m (OM1), 0m (OM2), 0m (OM3) Diagnostic Support : None Product Number : JL488A Serial Number : CN97KBG0BJ Part Number : 8121-1743