As networks become more sophisticated and infrastructure becomes more complex, network visibility becomes increasingly important.
HPE Aruba Networking recognizes this and has been investing heavily in telemetry data.
High-quality, clean telemetry data is essential for automation and powerful AIOps in today's world.
There are various types of network telemetry data collection methods, including SNMP, Syslog, IPFIX, and sFlow.
Today, I'd like to introduce you to a higher level of telemetry: the In-band Flow Analyzer (IFA).
IFA is a feature that allows users to monitor their network for faults and performance issues.
A real-time in-band hop-by-hop telemetry method that embeds diagnostic information directly into data packets as they traverse the network.
That is, it provides near real-time visibility into network performance, providing detailed insights into packet behavior at each hop.
For example, rather than just sending a message that a package has been delivered to your home, you can think of it as tracking the entire delivery process in real time and confirming, “This package is arriving on time and without any problems!”.
The main features of IFA are:.
- In-Packet Telemetry: Embed telemetry data into the packet itself to provide granular insights on a per-packet basis.
- Hop-by-Hop Visualization: Track performance metrics at every hop in your network to get a detailed analysis of the impact each device has on traffic.
- Real-time monitoring: Data is collected in near real-time, allowing for immediate detection of issues such as packet loss, high latency, or congestion.
Based on these features, it can have the following advantages:.
- Real-time troubleshooting: Quickly identify performance bottlenecks to reduce mean time to resolution (MTTR).
- Granular visibility: Provides deeper and more granular insights than traditional remote analysis methods such as syslog or SNMP.
- Proactive Performance Management: Helps network operators detect and resolve issues before they impact users.
- End-to-end service assurance: Provides continuous real-time insights across the entire network path to ensure that promised service levels (SLAs) are maintained.
Currently, in AOS-CX 10.15 version, only CX 9300 series switches support IFA.
To use the IFA feature, you must purchase a separate CX Advanced Feature Pack license.
The CX 9300 series offers additional advanced features beyond IFA by subscribing to an additional Advanced Feature Pack license.
- In-band Flow Analyzer (CX 9300-32D, CX 9300S)
- Queue Statistics Monitoring (CX 9300-32D, CX 9300S)
- MACsec Extension for WAN (CX 9300S)
IFA Use Cases
Here's why network monitoring is difficult:.
- Complex network structure: In a network with multiple devices and paths, it is very complicated to find the cause of a problem.
- Limitations of existing monitoring methods: Older methods like SNMP, NetFlow, and IPFIX struggle to provide detailed, real-time visibility across the entire network, especially when the path spans multiple stages.
- Slow data collection: Because data is collected and analyzed separately, delays occur and it is difficult to detect small issues (microbursts, congestion) or service level agreement (SLA) violations in real time.
This presents network administrators with the following challenges:.
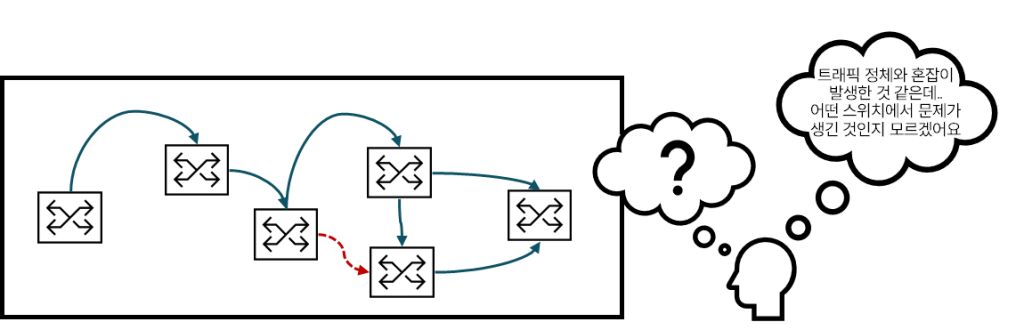
- Identifying the problem area: It's difficult to pinpoint exactly where issues like slowdowns, disconnects, and packet loss are occurring.
- Stagnation and Microbursts: Difficulty in detecting and resolving network congestion or momentary traffic surges before problems occur.
- Maintaining service quality: The difficulty of meeting service level agreements (SLAs) for delay-sensitive services such as voice, video, and financial transactions.
- Hybrid/Multi-Cloud Environment Challenges: The difficulty of troubleshooting network issues in cloud environments where traffic paths change frequently and visibility is limited.
Example scenario
Let's look at the examples below to see how IFA can be used differently from traditional telemetry collection methods.
- background: A large-scale data center environment where hundreds of thousands of servers are interconnected through numerous network switches and links.
- Problem: In large-scale systems, network performance anomalies (NPAs) such as packet loss, bandwidth reduction, and latency instability are major issues.
- Issues
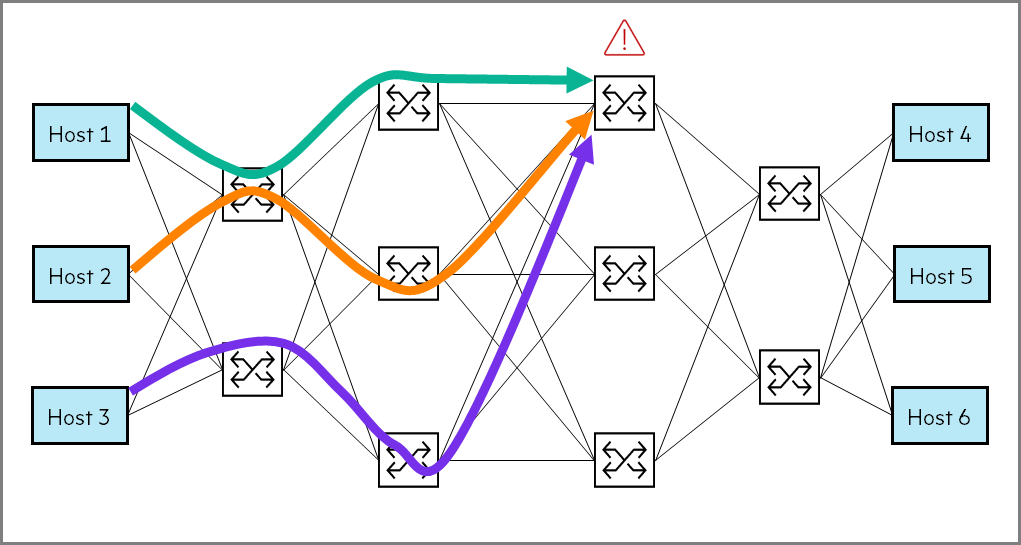
- data plane1The congestion ofPacket drop occurs at the network switch due to
- This causes the packet to be Not delivered there is.
- in result Increased application latencyI am doing it.
(e.g., website access is slow, video calls are cut off)
- target: Problem is occurring Finding and troubleshooting devices
- Challenge
- Minimize MTTR (Mean Time to Recovery): Minimize the time it takes to restore the system to normal state when a problem occurs.
- Identifying the problem path: Pinpoint the specific path where the problem is actually occurring among multiple data flow paths.
- Minimal network overhead: Diagnosing and resolving problems must not impact network performance.
- Solution
| function | Reasons to select or exclude |
|---|---|
| SNMP | It is difficult to pinpoint the specific cause of the problem, and you may see high resource usage when retrieving information from the device (Information is not provided in detail in real time.) |
| Syslog | It does not generate any specific event logs related to congestion or packets, and the system only forwards control plane event logs (Does not provide detailed information about data traffic) |
| IPFIX | It provides flow-level details, such as who is communicating with whom, but lacks fine-grained details, such as delay information, or hop-by-hop metadata.Limitations in identifying the cause of detailed performance issues) |
| sFlow | Lack of per-hop granular information needed to identify specific bottlenecks, and delayed fault identification due to the need to export sampled data to external collectors for analysis (Difficult to accurately identify real-time problems) |
| IP SLA | Generating synthetic probe packets that may not represent real application flows can lead to inaccurate results, and monitoring only certain predefined paths can miss real-time congestion that affects real dynamic flows (May not accurately reflect actual traffic conditions) |
| Traceroute | Trace path messages may travel along a different path than the one used by the data packets, which may result in false positives or false negatives (The path may not be accurate) |
| Ping | It may indicate high latency in the network, but does not provide hop-by-hop visibility like the forwarding latency of each device (Only overall delay can be confirmed, detailed problem location cannot be identified.) |
| IFA | Probe packets travel along the exact flow path, recording metadata such as queue depth, delay, and congestion metrics immediately at the end device. – Easily identify affected devices – Mapping the paths and devices through which congested packet flows pass. – Reduced MTTR (mean time to recovery) (It is very effective in troubleshooting by providing detailed diagnosis while following the actual traffic flow.) |
IFA does not replace the requirements of IPFIX, but rather supports different use cases.
Users can choose either (or both) depending on their use case and business requirements.
IFA (In-band Flow Analyzer) and SLA
- IFA can be a valuable tool for managing network service level agreements.
- It is complementary to IP SLA and provides more granular details.
- IP SLA probe packets may not follow the actual packet flow path where the problem occurs, but IFA provides this functionality.
(i.e. IFA follows the actual traffic path and enables accurate diagnosis)
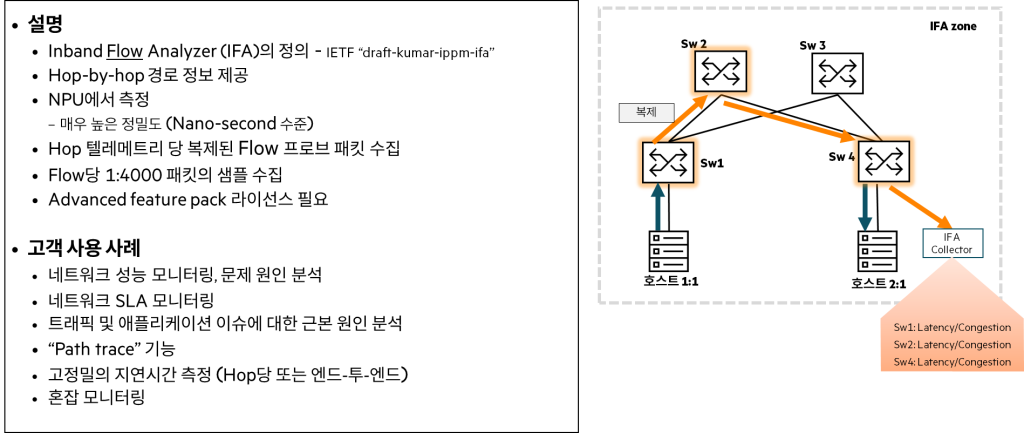
IFA detailed function description
To redefine it...
In-band Flow Analyzer (IFA) is a feature that allows users to monitor network faults and performance bottlenecks.
Simply put, IFA is like Special investigators roaming the networkIt's easy to understand if you think of it like this.
This investigator's role is to find out in real time whether there are any problems with the network and where there are blockages.
In an IFA zone, three types of nodes can be defined:
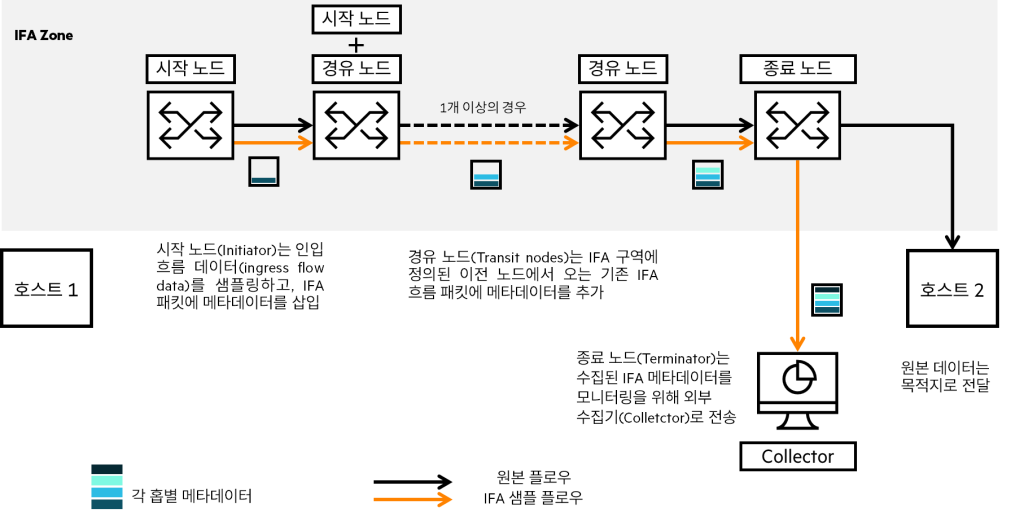
- Initiator: Generate IFA probe packets by sampling traffic and adding an IFA header and metadata to each sample.
- Transit Node: Identifying IFA probe packets
Validate the probe packet and add node metadata after the IFA metadata header of the probe packet. - Terminator: Move packets to the CPU
Here, the data is used to generate IFA metric information that will be provided to the user.
The IFA packet is It must follow the same path as the original packet. Sampled copy packets must be discarded at the termination node.
Metadata collected from IFA packets is extracted by the endpoint node and exposed to the user via CLI or REST.
If you look at the Flow Metric information at the end node, you can see that the following values are output.
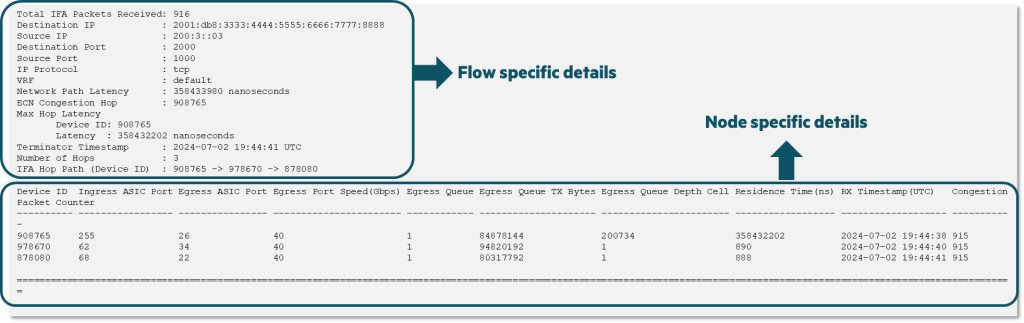
When looking at the details for each node, the values in each column mean the following:.
- Device ID: Device ID of each node
- Ingress ASIC Port: ASIC port number of the incoming flow
- Egress ASIC Port: ASIC port number of the outgoing flow
- Egress Port Speed: Speed of outgoing port (Gbps)
- Egress Queue: Queue ID
- Egress Queue TX Bytes: Size of data transferred from a specific Queue (in bytes)
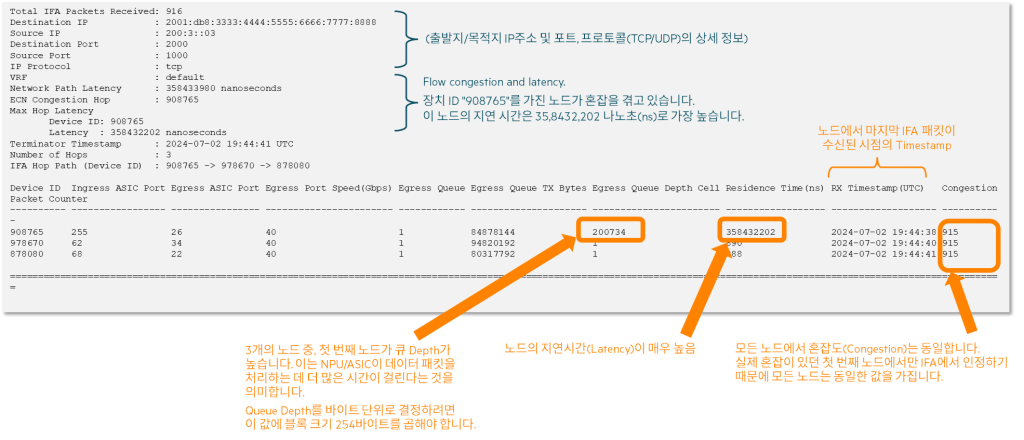
- Egress Queue Depth Cell: Packets in the queue waiting to be processed (1 Cell = 254 bytes)
- Residense Time(ns): Packet transit time at a specific node
- RX Timestamp (UTC): The moment the last IFA packet is received from the node
- Congestion Packet Counter: Number of packets marked with congestion information (only data from the first congested node is displayed)
That is, through the example output above, you can find out the issue at a specific node as shown below.
How to configure IFA
Check Feature Pack
As mentioned earlier, configuring IFA requires an Advanced Feature Pack license.
switch(config)# show feature-pack
Feature Pack Summary ====================
Name: CX Advanced Feature Pack
Expiration Date : Fri Aug 12 2033 Serial Number(s) : TW1ERGVFDS MAC Address : bb:aa:5b:63:90:00 Hostname : 9300 Platform : 8/9xxx Type : Device specific Mode : File Based
State: Feature pack installed and valid
Error Reason: none Subscription Feature Feature Status Status --------------------------------------------------------------------------------
Inband Flow Analyzer active not running
MACsec extensions for WAN active not running Queue Statistics Monitoring active not running
ECN configuration
To configure an IFA, you must create one or more threshold profiles via ECN.
(Configuration required even if you don't use DCB or RoCEv2)
switch(config)# qos threshold-profile
  NAME The name of the Threshold Profile (maximum of 64 characters) switch(config)# qos threshold-profile ecnprofile
switch(config-threshold)# queue 7 action ecn all threshold 20 kbytes
switch(config-threshold)# exit
Apply the configured threshold profile to global ports (all ports) or to specific ports where action is required.
switch(config)# apply qos threshold-profile
  NAME The threshold-profile to apply switch(config)# apply qos threshold-profile ecnprofile
switch(config)# interface 1/1/2
switch(config-if)# apply qos threshold-profile ecnprofile There are several possible scenarios depending on whether ECN is configured along the entire path.
1. Transit node Number 3If you configure ECN from
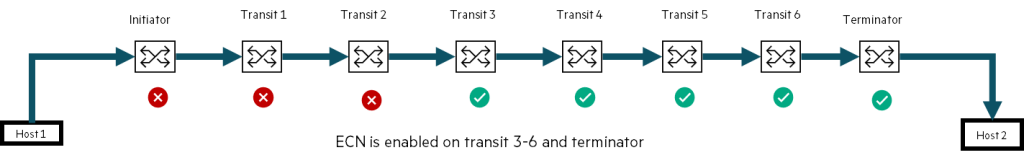
In this case, if congestion occurs at or before waypoint 3, the terminator marks waypoint 3 as the first node to report ECN congestion.
If the starting node or transit nodes 1 and 2 are congested, ECN is turned off, so this information is not displayed at the exit node.
2. If only ECN is configured for transit node 4
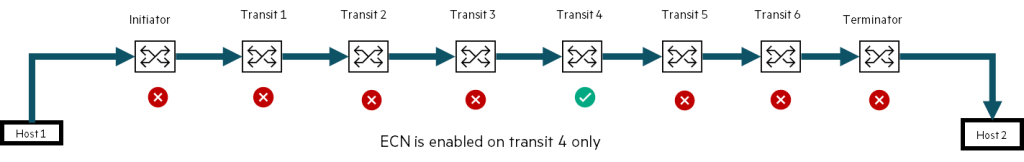
In this case, the user can see congestion indicator packets originating from transit node 4.
For all subsequent nodes, the IFA packet is already marked as "congestion detected." The exit node indicates congestion at node 4.
Initiator configuration
1. Configure the Flow Telemetry profile
switch(config)# flow-telemetry-profile
switch(config-flow-telemetry-profile)# end End current mode and change to enable mode. exit Exit current mode and change to previous mode flow-control Configure flow control
  ifa-device-id Configure the IFA Device ID for Flow Telemetry Profile. (Default: "auto") ifa-hop-limit Configure the IFA Hop Limit. (Default: 10) ifa-max-metadata-stack-length Configure the IFA Max Metadata Stack Length for Flow Telemetry Profile. (Default: 80) ifa-sampling-rate Configure the IFA Sampling Rate. (Default: 4)
  list Print command list no Negate a command or set its defaults show Show running system information vsx-sync Enable VSX config sync for this context
ifa-device-id Configure the device ID that appears in the IFA packet with the command.
The default is “auto”, which sets the lower 20 bits of the switch MAC address as the device ID.
switch(config-flow-telemetry-profile)# ifa-device-id
  VALUE <0-1048575> IFA Device ID valid values. This parameter is optional. auto Configure the IFA Device ID for Flow Telemetry Profile in mode auto switch(config-flow-telemetry-profile)# ifa-device-id 10
                          OR
switch(config-flow-telemetry-profile)# ifa-device-id auto
You cannot use negative numbers (-) as device IDs. “
no” If you use the commandautoIt is set to the same MAC address as the command.
ifa-hop-limit Set the maximum hop count for IFA metadata with the command. You need to determine the number of hops required to reach the end node.
The default is 10, and if you set it to less than the required number of hops, only metadata for a limited number of hops (the first 10 hops) will be collected.
switch(config-flow-telemetry-profile)# ifa-hop-limit
  VALUE <1-255> IFA Hop Limit valid values. switch(config-flow-telemetry-profile)# ifa-hop-limit 0
Invalid IFA Hop Limit. A valid value must be between <1-255>. switch(config-flow-telemetry-profile)# ifa-hop-limit 4
ifa-max-metadata-stack-length The command is a user-defined value used in the IFA packet header.
The default is 80, which causes AOS-CX to add 8 octets of IFA metadata per hop.
The stack length is checked at each hop to ensure that it does not exceed the configured maximum value.
switch(config-flow-telemetry-profile)# ifa-max-metadata-stack-length
  VALUE <8-248> IFA Max Metadata Stack Length valid values. switch(config-flow-telemetry-profile)# ifa-max-metadata-stack-length -1
Invalid IFA Max Metadata Stack Length. A valid value must be between <8-248>. switch(config-flow-telemetry-profile)# ifa-max-metadata-stack-length 160
ifa-sampling-rate The command specifies the rate of IFA packet sampling.
AOS-CX switches can sample incoming Flow data based on defined values.
The sampling rate is determined by multiples of 1000 packets (4 = 1 in 4,000; 4,200,000 = 1 in 4.2 billion).
switch(config-flow-telemetry-profile)# ifa-sampling-rate
  VALUE <4-4200000> IFA Sampling Rate valid values in multiples of thousand packets. switch(config-flow-telemetry-profile)# ifa-sampling-rate 8
2. IFA class configuration
Define an IFA class using the Class command. The IFA uses this defined class to copy packets to the CPU.
It depends on the IP Flow type, enter IPv4 or IPv6.
switch(config)# class
  all All classes ifa-ip IFA based Internet Protocol v4 (IFA-IPv4) ifa-ipv6 IFA based Internet Protocol v6 (IFA-IPv6) ip Internet Protocol v4 (IPv4) ipv6 Internet Protocol v6 (IPv6) mac Ethernet MAC Protocol (MAC)
Once you have defined your Flow type, give it a name.
switch(config)# class ifa-ip
  NAME The class name (maximum 128 characters) switch(config)# class ifa-ip class-ifa
switch(config-class-ifa-ip)#
You can configure the parameter values of the IFA class.
switch(config-class-ifa-ip)# <1-4294967295> Entry sequence number comment Add or update comment describing entry end End current mode and change to enable mode. exit Exit current mode and change to previous mode flow-control Configure flow control ignore Ignore packets with this criteria list Print command list match Match packets with this criteria no Negate a command or set its defaults show Show running system information vsx-sync Enable VSX config sync for this contextInsert a filter sequence and a 5-tuple of traffic2Define match/ignore criteria based on .
If you don't define a sequence, the system automatically assigns a value to each filter entry (same as configuring a firewall/ACL policy).
switch(config-class-ifa-ip)# 1
  comment Add or update comment describing entry ignore Ignore packets with this criteria match Match packets with this criteria switch(config-class-ifa-ip)# 1 match
  <0-255> Numeric protocol value ah Authentication Header any Any Internet Protocol esp Encapsulation Security Payload gre Generic Routing Encapsulation igmp Internet Group Management Protocol ip Any Internet Protocol ospf Open Shortest Path First (version 2) pim Protocol Independent Multicast sctp Stream Control Transmission Protocol tcp Transmission Control Protocol udp User Datagram Protocol
The current version of IFA only supports configuring TCP/UDP protocols (configuring "any" also works).
switch(config-class-ifa-ip)# 1 match udp
  ABCD Source IP host address ABCD/M Source IP network address with prefix length ABCD/WXYZ Source IP network address with network mask any Any source IP address switch(config-class-ifa-ip)# 1 match udp 1.2.3.4 eq 80
  ABCD Destination IP host address ABCD/M Destination IP network address with prefix length ABCD/WXYZ Destination IP network address with network mask any Any destination IP address switch(config-class-ifa-ip)# 1 match udp 1.2.3.4 eq 80 6.7.8.9 eq 80
You can repeat the above process to create more rules for each class (up to 50).
“no”You can also delete the rule using the " command.
3. Configure monitoring and assign classes
ifa-initiator-monitor Configures the command to connect predefined classes.
switch(config)# flow ifa-initiator-monitor
  NAME Flow IFA Initiator Monitor Name (maximum 45 characters). switch(config)# flow ifa-initiator-monitor initiator1
switch(config-flow-ifa-initiator-monitor)# end End current mode and change to enable mode. exit Exit current mode and change to previous mode flow-control Configure flow control flow-filter-class Assign a Flow Filter Class. list Print command list no Negate a command or set its defaults show Show running system information vsx-sync Enable VSX config sync for this context switch(config-flow-ifa-initiator-monitor)# flow-filter-class
  NAME Flow Filter Class name. switch(config-flow-ifa-initiator-monitor)# flow-filter-class class-ifa
Before configuring an IFA initiator monitor, you must define a class.
If you enter a name that does not exist because the class is not defined, an error will occur.
switch(config-flow-ifa-initiator-monitor)# flow-filter-class class1
Invalid Flow Filter Class assigned. The given Class name does not correspond to any IFA Class type or it is not configured.
4. Apply the IFA initiator monitor to the system
Configured previously ifa-initiator-monitorApply to the system.
switch(config)# ip flow ifa-initiator-monitor initiator1
OR switch(config)# ipv6 flow ifa-initiator-monitor initiator2
Or, apply it to a specific interface.
switch(config)# interface 1/1/1
switch(config-if)# ip flow ifa-initiator-monitor initiator1
It is also possible to apply it to multiple interfaces together.
switch(config)# interface 1/1/1,1/1/2
switch(config-if-<1/1/1,1/1/2>)# ip flow ifa-initiator-monitor initiator1
Monitor configuration must match the class IP version.
If you need to update or modify a class after configuring an IFA Initiator Monitor, you must re-apply the monitor.
switch(config)# class ifa-ip class-ifa
switch(config-class-ifa-ip)# 2 match tcp any 10.10.10.10
switch(config)# no ip flow ifa-initiator-monitor initiator1
switch(config)# ip flow ifa-initiator-monitor initiator1
Configuring Transit and Terminator Nodes
There is no need to configure telemetry profiles on transit and termination nodes.
Instead, you can optionally define device IDs depending on your deployment environment.
IFA Flow Monitor is configured at the system level, not per port.
switch(config)# ip-all flow
  ifa-terminator-monitor Configure IFA Terminator Monitor. // End node
  ifa-transit-monitor Configure IFA Transit Monitor.    // transit node
Currently, Terminator only supports CLI output and REST for IFA metrics.
REST API is “
system/flow_telemetry_profile/xxx“GET/UPDATE is possible via .
https://developer.arubanetworks.com/aoscx/docs/introduction
IFA said, “show” commands allow for a variety of troubleshooting.
You can check the currently configured classes, telemetry profiles, monitor details, etc.
For more detailed commands and guide documents, please refer to the URL and video below.
https://arubanetworking.hpe.com/techdocs/AOS-CX/10.15/HTML/monitoring_8100-83xx-9300-10000/Content/Chp_IFA/ifa.htm