1. Introduction: Infrastructure Monitoring, Why Icinga 2?
When operating enterprise networks and infrastructure, the open-source monitoring tool most familiar to domestic engineers is by far the ZabbixIt has become the standard in numerous enterprise environments thanks to its intuitive web GUI, various basic templates, and an all-in-one environment consisting of a single package.
However, the infrastructure operation paradigm is IaC (Infrastructure as Code) 및 NetDevOps Move quickly to the centerConsequently, there is a growing demand to transition monitoring settings from the “method of registering one by one with a GUI click” to a “method of defining in code and managing versions using Git and CI/CD pipelines (Monitoring-as-Code).”.
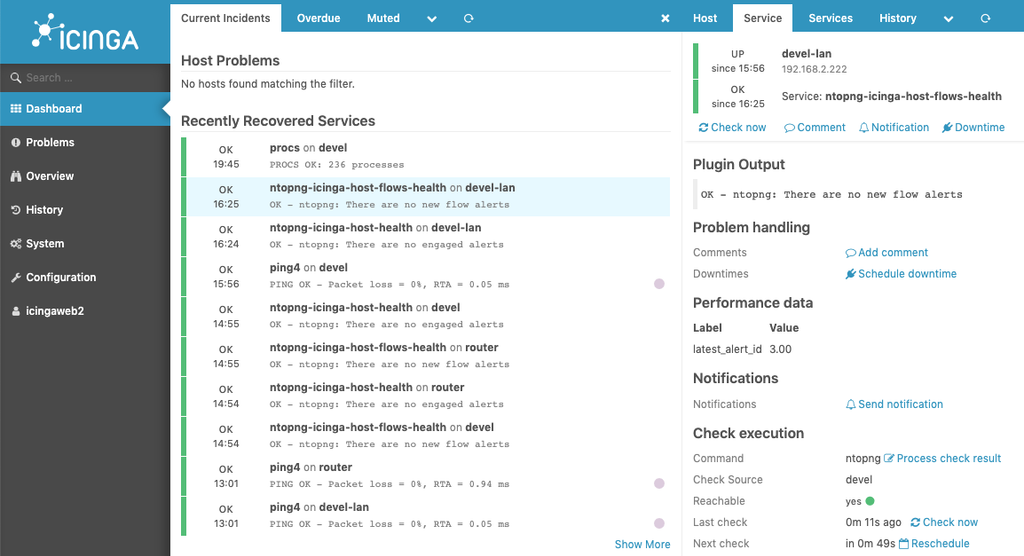
The solution attracting attention here as the most flexible and powerful alternative is precisely Icinga 2no see.
2. Icinga 2 vs Zabbix at a Glance
The two solutions show a distinct difference in their design philosophy regarding infrastructure.

| Comparison items | Zabbix | Icinga 2 |
| Design Philosophy | All-in-One Integrated Solution | Modular Distributed Architecture & Monitoring-as-Code |
| How to set up | Web GUI-centric (templates and auto-discovery) | Object-Oriented Configuration DSL (Text File), Icinga Director |
| Automation integration | Web API-based automation | Optimizing IaC pipelines with Ansible, Puppet, Terraform, etc. |
| Data collection | Built-in collector and Zabbix Agent-centric | Rich Nagios plugin ecosystem + custom scripts |
| Visualization (UI) | Fully equipped with built-in dashboard and metric graphs | Icinga Web 2 (Grafana integration recommended for long-term metrics) |
| Suitable environment | Rapid GUI deployment and a single control room environment | DevOps/IaC environment, infrastructure requiring sophisticated custom checks |
Key to Network Equipment Management: Agentless vs. Agent-based
In server environments (Linux/Windows), in the form of a daemon Icinga AgentYou can perform local checks by installing it, but network appliances such as switches and routers cannot install external third-party agents due to the nature of their proprietary OS.
Therefore, the standard architecture for the AOS-CX switch is to configure it using an agentless method (remote SNMP + REST API calls) where the Icinga master server (or satellite node) queries directly from the outside.
3. AOS-CX Monitoring Architecture: A Hybrid Combination of SNMP and REST API
The AOS-CX switch is a modern State Database It is a cloud-native network OS that adopts a structure in which all internal status and settings of the equipment are exposed via REST API.
- SNMPv3: It is optimized for high-speed polling (1-minute cycle) of interface traffic, port status, and underlying hardware sensor data with a lightweight packet size.
- REST API: Sophistically collects deep status data, such as VSX (Virtual Switching Extension) synchronization status, ISL link detail status, and NAE (Network Analytics Engine) events, using JSON-based structured data (every 3–5 minutes).
4. Practical Guide: Step-by-Step Integration Procedure
🪄Advance Notice
The Icinga 2 core engine and Icinga Web 2 basic installation are Icinga Official Installation Guide (Official Documentation)Please refer to [link]. This practice is conducted with the Icinga 2 infrastructure running normally.
Step 1. AOS-CX Switch Pre-configuration
Connect to the AOS-CX switch CLI and apply a read-only account for REST API access, HTTPS server mode, and enhanced SNMPv3 settings.
! 1. Enable REST API and Create Dedicated Read-Only Account
switch# configure terminal
switch(config)# https-server rest access-mode read-only
switch(config)# user icinga_mon group operators password plaintext MyStrongPassword123!

! 2. SNMPv3 Credentials and Group Settings
switch(config)# snmpv3 user icinga-snmp-user auth sha AuthSecretKey123! priv aes PrivSecretKey123!
switch(config)# snmpv3 group icinga-group user icinga-snmp-user sec-model usm
switch(config)# snmpv3 access icinga-group sec-model usm sec-level priv read-view default
Step 2. Create an AOS-CX REST API Custom Plugin
Write a Python script in the plugin directory of the Icinga 2 server that communicates with the AOS-CX REST API to check system health and VSX status.
sudo vi /usr/lib/nagios/plugins/check_aoscx_health.py#!/usr/bin/env python3
"""""
Aruba AOS-CX Health Checker for Icinga 2 (VSX / VSF / Firmware / Subsystems)
"""""
import sys
import argparse
import requests
import urllib3
urllib3.disable_warnings(urllib3.exceptions.InsecureRequestWarning)
def check_cx(host, user, password):
base_url = f""https://{host}/rest/v10.04""
session = requests.Session()
session.verify = False
try:
# 1. Login
login_res = session.post(
f"""{base_url}/login"",
data={"""username""": user, """password""": password},
timeout=5
)
if login_res.status_code != 200:
print(f""CRITICAL - Authentication failed on {host}""")
sys.exit(2)
# 2. Check Firmware Version (/system)
sys_res = session.get(f"""{base_url}/system"", timeout=5)
fw_version = """Unknown"""
if sys_res.status_code == 200:
fw_version = sys_res.json().get("""software_version""", """Unknown""")
# 3. Check VSF stack status (/system/vsf)
vsf_res = session.get(f"""{base_url}/system/vsf"", timeout=5)
is_vsf = False
vsf_msg = """"
vsf_status = 0 # 0: OK, 1: WARNING, 2: CRITICAL
if vsf_res.status_code == 200 and vsf_res.json():
vsf_data = vsf_res.json()
In the case of a device where # VSF is configured and activated
if vsf_data.get("""topology""") != """standalone""":
is_vsf = True
topo = vsf_data.get("""topology""", """unknown""")
oper_state = vsf_data.get("""oper_state""", """unknown""")
If the # stack link is broken and the Ring has changed to a Chain, or if there is an error
if topo != """ring""" or oper_state != """normal""":
vsf_status = 1 # WARNING
vsf_msg = f""[VSF Warning: topo={topo}, state={oper_state}]""
else:
vsf_msg = f""[VSF OK: {topo}]""
# 4. Check VSX status (/system/vsx)
vsx_res = session.get(f"""{base_url}/system/vsx"", timeout=5)
is_vsx = False
vsx_msg = """"
vsx_status = 0
if vsx_res.status_code == 200 and vsx_res.json():
vsx_data = vsx_res.json()
is_vsx = True
isl_state = vsx_data.get("""isl_port_state""", """unknown""")
if isl_state not in ["""in-sync""", """up"""]:
vsx_status = 1
vsx_msg = f""[VSX Warning: ISL={isl_state}]""
else:
vsx_msg = """[VSX OK: in-sync]"""
# Log Out
session.post(f"""{base_url}/logout"", timeout=5)
# 5. Final Overall Status Determination
summary = f"FW: {fw_version}"""
if is_vsf:
summary += f"" | {vsf_msg}"""
elif is_vsx:
summary += f"" | {vsx_msg}"""
else:
summary += """ | [Standalone]"""
if vsf_status == 2 or vsx_status == 2:
print(f"CRITICAL - {summary} on {host}""")
sys.exit(2)
elif vsf_status == 1 or vsx_status == 1:
print(f"WARNING - {summary} on {host}""")
sys.exit(1)
print(f"OK - {summary} on {host}""")
sys.exit(0)
except requests.exceptions.RequestException as e:
print(f""CRITICAL - Connection failed: {str(e)}""")
sys.exit(2)
if __name__ == """__main__""":
parser = argparse.ArgumentParser(description="""Icinga 2 AOS-CX Health Checker""")
parser.add_argument("""-H""", """--host""", required=True, help="""Switch IP/FQDN""")
parser.add_argument("""-u""", """--user""", required=True, help="""API Username""")
parser.add_argument("""-p""", """--password""", required=True, help="""API Password""")
args = parser.parse_args()
check_cx(args.host, args.user, args.password)Grant # execute permissions
sudo chmod +x /usr/lib/nagios/plugins/check_aoscx_health.pyStep 3. Define Icinga 2 CheckCommand
Register the Python plugin you wrote as an Icinga 2 command object.
sudo vi /etc/icinga2/conf.d/commands_aoscx.confobject CheckCommand "aoscx_rest_health" {
import "plugin-check-command""
command = [ PluginDir + "/check_aoscx_health.py" ]
arguments = {
""-H" = "$address$""
""-u" = "$aoscx_api_user$""
""-p" = "$aoscx_api_password$""
}
vars.aoscx_api_user = "$host.vars.aoscx_user$""
vars.aoscx_api_password = "$host.vars.aoscx_pass$""
}Step 4. Define Host and Service Apply Rules
A powerful feature of Icinga 2 Apply RuleBy utilizing os == "AOS-CX"" Configure the monitoring service to automatically bind to all switches with the attribute.
sudo vi /etc/icinga2/conf.d/hosts_switches.confModify and enter the IP address (or FQDN), account information, and SNMP information of the monitored device appropriately.
object Host "SW-CORE-01" {
  import "generic-host""
  address = "192.168.10.1""

  vars.os = "AOS-CX""
  vars.model = "CX6300""

  // REST API credentials
  vars.aoscx_user = "icinga_mon""
  vars.aoscx_pass = "MyStrongPassword123!""

  // SNMPv3 credentials
  vars.snmp_v3 = true
  vars.snmp_v3_user = "icinga-snmp-user""
  vars.snmp_v3_auth_key = "AuthSecretKey123!""
  vars.snmp_v3_priv_key = "PrivSecretKey123!""
}sudo vi /etc/icinga2/conf.d/services_aoscx.conf// 1. SNMP interface status check (1-minute interval)
apply Service "SNMP-Interface-Status" {
import "generic-service""
check_command = "nwc_health""
vars.nwc_health_mode = "interface-usage""
check_interval = 1m
assign where host.vars.os == "AOS-CX""
}
// 2. REST API Deep Health and VSX Health Checks (every 3 minutes)
apply Service "REST-AOSCX-Health" {
import "generic-service""
check_command = "aoscx_rest_health""
check_interval = 3m
assign where host.vars.os == "AOS-CX""
}Step 5. Verify and apply settings
# configuration file syntax verification
sudo icinga2 daemon -C

Reload Daemon on successful # verification
sudo systemctl reload icinga2
5. Bonus: Wireless Infrastructure (Controller/AP) and Aruba Central Extension Templates
By applying the same architectural rules, wireless controllers and Aruba Central cloud environments can also be easily extended to be monitored.
1) Aruba Mobility Controller / AP Monitoring (hosts_aruba_wireless.conf)
object Host "MC-CAMPUS-01" {
  import "generic-host""

  // 1) Controller or IAP Virtual Controller (VIP) IP (Required)
  address = "192.168.20.10""

  vars.os = "ArubaOS-Wireless""
  vars.role = "Mobility-Controller""

  // 2) SNMP community string or SNMPv3 credentials (required)
  // When using SNMPv2c:
  vars.snmp_community = "My_SNMP_CommunityName""

  // When using SNMPv3:
  // vars.snmp_v3 = true
  // vars.snmp_v3_user = "icinga-snmp-user""
  // vars.snmp_v3_auth_key = "AuthSecretKey123!""
  // vars.snmp_v3_priv_key = "PrivSecretKey123!""
}
2) Aruba Central Cloud API Integration (hosts_aruba_central.conf)
Step 1. Create a Central REST API Custom Plugin
sudo vi /usr/lib/nagios/plugins/check_aruba_central.py#!/usr/bin/env python3
import sys
import argparse
import requests
def check_central(api_host, token):
url = f""https://{api_host}/monitoring/v2/aps""
headers = {
"""Authorization""": f""Bearer {token}""",
"""Content-Type""": """application/json"""
}
try:
# Central AP Inventory and Status Inquiry
res = requests.get(url, headers=headers, params={"""limit""": 50}, timeout=10)
if res.status_code == 401:
print("""CRITICAL - Central API Token Expired or Invalid""")
sys.exit(2)
elif res.status_code != 200:
print(f""WARNING - Central API Error: HTTP {res.status_code}""")
sys.exit(1)
data = res.json()
aps = data.get("""aps""", [])
total_aps = len(aps)
down_aps = [ap.get("""name""", """Unknown""") for ap in aps if ap.get("""status""") != """Up"""]
if down_aps:
print(f"CRITICAL - {len(down_aps)} AP(s) Down: {', '.join(down_aps[:3])}..."")
sys.exit(2)
print(f"OK - All {total_aps} AP(s) Up and healthy on Central"")
sys.exit(0)
except requests.exceptions.RequestException as e:
print(f""CRITICAL - Connection to Central failed: {str(e)}""")
sys.exit(2)
if __name__ == """__main__""":
parser = argparse.ArgumentParser()
parser.add_argument("""-H""", """--host""", required=True, help="""Central API FQDN""")
parser.add_argument("""-T""", """--token""", required=True, help="""Central Bearer Token""")
args = parser.parse_args()
check_central(args.host, args.token)sudo chmod +x /usr/lib/nagios/plugins/check_aruba_central.pyStep 2. Define Icinga2 commands
sudo vi /etc/icinga2/conf.d/commands_central.confobject CheckCommand "aruba_central_api_check" {
import "plugin-check-command""
command = [ PluginDir + "/check_aruba_central.py" ]
arguments = {
""-H" = "$address$""
""-T" = "$central_api_token$""
}
}Step 3. Register Host and Service – Enter Token and Address
sudo vi /etc/icinga2/conf.d/hosts_aruba_central.confobject Host "Aruba-Central-Cloud" {
import "generic-host""
// 1) Central API Gateway FQDN by Region (Required)
// (e.g., Korea/Asia: apigw-apaceast.central.arubanetworks.com, etc., your account's region address)
address = "https://apigw-apaceast.central.arubanetworks.com""
vars.platform = "Aruba-Central""
// 2) Central Customer Account ID (Customer ID)
vars.central_customer_id = "12345678""
// 3) Bearer Token issued by Central API Gateway (Required)
vars.central_token = "eyJhbGciOiJSUzI1NiIsInR5cCI6...""
}API Gateway Address List (https://developer.arubanetworks.com/central/docs/api-oauth-access-token)
Step 4. Verify and apply settings
# configuration file syntax verification
sudo icinga2 daemon -C

Reload Daemon on successful # verification
sudo systemctl reload icinga2
6. Wrap-up and Next Episode Preview
In this first part Key differences from ZabbixBased on, Basic pipeline for integrating AOS-CX switches with Icinga 2 using SNMPv3 and REST APII have completed it.
In the next [Part 2: Advanced Practical Application], we take it a step further and cover topics that maximize enterprise operational efficiency.
- Icinga Director & Template Engine: Web UI-based large-scale switch batch registration
- Aruba Central Monitoring Item Expansion: Performance Data-based Telemetry Extension
- Grafana & InfluxDB Integration: Traffic and hardware telemetry time series dashboard visualization
- AOS-CX NAE Webhook Integration: Real-time push (Passive Check) monitoring when internal switch abnormal signs occur
- Ansible & EventCommand: Automatic registration of new equipment and self-healing pipeline in case of failure