1. 들어가며: 인프라 관제, 왜 Icinga 2인가?
엔터프라이즈 네트워크 및 인프라를 운영할 때 국내 엔지니어들에게 가장 친숙한 오픈소스 관제 도구는 단연 Zabbix입니다. 직관적인 웹 GUI, 다양한 기본 템플릿, 단일 패키지로 구성되는 올인원(All-in-One) 환경 덕분에 수많은 엔터프라이즈 환경에서 표준으로 자리 잡았습니다.
하지만 인프라 운영 패러다임이 IaC(Infrastructure as Code) 및 NetDevOps 중심으로 빠르게 이동하면서, 모니터링 설정 역시 “GUI에서 클릭으로 하나씩 등록하는 방식”에서 “코드로 정의하고 Git과 CI/CD 파이프라인으로 버전 관리하는 방식(Monitoring-as-Code)”으로의 전환 요구가 커지고 있습니다.
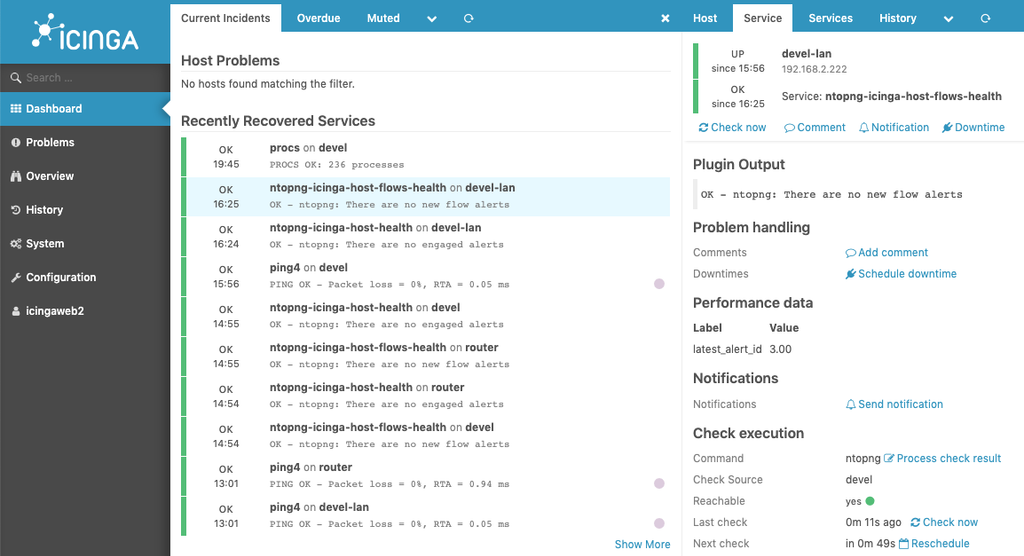
여기서 가장 유연하고 강력한 대안으로 주목받는 솔루션이 바로 Icinga 2입니다.
2. 한눈에 비교하는 Icinga 2 vs Zabbix
두 솔루션은 인프라를 바라보는 설계 철학에서 뚜렷한 차이를 보입니다.
| 비교 항목 | Zabbix | Icinga 2 |
| 설계 철학 | 올인원(All-in-One) 통합 솔루션 | 모듈형 분산 구조 & Monitoring-as-Code |
| 설정 방식 | 웹 GUI 중심 (템플릿 및 자동 검색) | 객체 지향 설정 DSL (텍스트 파일), Icinga Director |
| 자동화 연동 | Web API 기반 자동화 | Ansible, Puppet, Terraform 등 IaC 파이프라인 최적화 |
| 데이터 수집 | 자체 내장 수집기 및 Zabbix Agent 중심 | 풍부한 Nagios 플러그인 생태계 + 커스텀 스크립트 |
| 시각화 (UI) | 내장 대시보드 및 지표 그래프 완비 | Icinga Web 2 (장기 메트릭은 Grafana 연동 권장) |
| 적합한 환경 | 빠른 GUI 구축 및 단일 관제실 환경 | DevOps/IaC 환경, 정교한 커스텀 체크가 필요한 인프라 |
네트워크 장비 관제에서의 핵심: Agentless vs Agent-based
서버 환경(Linux/Windows)에서는 데몬 형태의 Icinga Agent를 설치하여 로컬 체크를 수행할 수 있지만, 스위치/라우터와 같은 네트워크 어플라이언스는 전용 OS 특성상 외부 서드파티 에이전트 설치가 불가능합니다.
따라서 AOS-CX 스위치는 Icinga 마스터 서버(또는 새틀라이트 노드)가 외부에서 직접 질의하는 Agentless 방식(원격 SNMP + REST API 호출)으로 구성하는 것이 표준 아키텍처입니다.
3. AOS-CX 관제 아키텍처: SNMP와 REST API의 하이브리드 결합
AOS-CX 스위치는 현대적인 상태 데이터베이스(State Database) 구조를 채택하여 장비의 모든 내부 상태와 설정이 REST API로 100% 노출되는 클라우드 네이티브 네트워크 OS입니다.
- SNMPv3: 가벼운 패킷 크기로 인터페이스 트래픽, 포트 상태, 기본 하드웨어 센서 데이터를 고속 폴링(1분 주기)하는 데 최적화되어 있습니다.
- REST API: JSON 기반의 구조화된 데이터로 VSX(Virtual Switching Extension) 동기화 상태, ISL 링크 세부 상태, NAE(Network Analytics Engine) 이벤트와 같은 심층 상태를 정교하게 수집(3~5분 주기)합니다.
4. 실전 가이드: Step-by-Step 연동 절차
🪄사전 안내
Icinga 2 코어 엔진 및 Icinga Web 2 기본 설치는 Icinga 공식 설치 가이드(Official Documentation)를 참고하시기 바랍니다. 본 실습은 Icinga 2 인프라가 정상 구동 중인 상태에서 진행합니다.
Step 1. AOS-CX 스위치 사전 설정
AOS-CX 스위치 CLI에 접속하여 REST API 접근을 위한 읽기 전용 계정과 HTTPS 서버 모드, 그리고 보안 강화된 SNMPv3 설정을 적용합니다.
! 1. REST API 활성화 및 전용 Read-Only 계정 생성
switch# configure terminal
switch(config)# https-server rest access-mode read-only
switch(config)# user icinga_mon group operators password plaintext MyStrongPassword123!

! 2. SNMPv3 자격 증명 및 그룹 설정
switch(config)# snmpv3 user icinga-snmp-user auth sha AuthSecretKey123! priv aes PrivSecretKey123!
switch(config)# snmpv3 group icinga-group user icinga-snmp-user sec-model usm
switch(config)# snmpv3 access icinga-group sec-model usm sec-level priv read-view defaultStep 2. AOS-CX REST API 커스텀 플러그인 작성
Icinga 2 서버의 플러그인 디렉터리에 AOS-CX REST API와 통신하여 시스템 헬스 및 VSX 상태를 검사하는 Python 스크립트를 작성합니다.
sudo vi /usr/lib/nagios/plugins/check_aoscx_health.py#!/usr/bin/env python3
"""
Aruba AOS-CX Health Checker for Icinga 2 (VSX / VSF / Firmware / Subsystems)
"""
import sys
import argparse
import requests
import urllib3
urllib3.disable_warnings(urllib3.exceptions.InsecureRequestWarning)
def check_cx(host, user, password):
base_url = f"https://{host}/rest/v10.04"
session = requests.Session()
session.verify = False
try:
# 1. Login
login_res = session.post(
f"{base_url}/login",
data={"username": user, "password": password},
timeout=5
)
if login_res.status_code != 200:
print(f"CRITICAL - Authentication failed on {host}")
sys.exit(2)
# 2. 펌웨어 버전 조회 (/system)
sys_res = session.get(f"{base_url}/system", timeout=5)
fw_version = "Unknown"
if sys_res.status_code == 200:
fw_version = sys_res.json().get("software_version", "Unknown")
# 3. VSF 스택 상태 확인 (/system/vsf)
vsf_res = session.get(f"{base_url}/system/vsf", timeout=5)
is_vsf = False
vsf_msg = ""
vsf_status = 0 # 0: OK, 1: WARNING, 2: CRITICAL
if vsf_res.status_code == 200 and vsf_res.json():
vsf_data = vsf_res.json()
# VSF가 구성되어 활성화된 장비인 경우
if vsf_data.get("topology") != "standalone":
is_vsf = True
topo = vsf_data.get("topology", "unknown")
oper_state = vsf_data.get("oper_state", "unknown")
# 스택 링크가 끊겨 Ring이 Chain으로 바뀌었거나 에러인 경우
if topo != "ring" or oper_state != "normal":
vsf_status = 1 # WARNING
vsf_msg = f"[VSF Warning: topo={topo}, state={oper_state}]"
else:
vsf_msg = f"[VSF OK: {topo}]"
# 4. VSX 상태 확인 (/system/vsx)
vsx_res = session.get(f"{base_url}/system/vsx", timeout=5)
is_vsx = False
vsx_msg = ""
vsx_status = 0
if vsx_res.status_code == 200 and vsx_res.json():
vsx_data = vsx_res.json()
is_vsx = True
isl_state = vsx_data.get("isl_port_state", "unknown")
if isl_state not in ["in-sync", "up"]:
vsx_status = 1
vsx_msg = f"[VSX Warning: ISL={isl_state}]"
else:
vsx_msg = "[VSX OK: in-sync]"
# 로그아웃
session.post(f"{base_url}/logout", timeout=5)
# 5. 최종 종합 상태 판정
summary = f"FW: {fw_version}"
if is_vsf:
summary += f" | {vsf_msg}"
elif is_vsx:
summary += f" | {vsx_msg}"
else:
summary += " | [Standalone]"
if vsf_status == 2 or vsx_status == 2:
print(f"CRITICAL - {summary} on {host}")
sys.exit(2)
elif vsf_status == 1 or vsx_status == 1:
print(f"WARNING - {summary} on {host}")
sys.exit(1)
print(f"OK - {summary} on {host}")
sys.exit(0)
except requests.exceptions.RequestException as e:
print(f"CRITICAL - Connection failed: {str(e)}")
sys.exit(2)
if __name__ == "__main__":
parser = argparse.ArgumentParser(description="Icinga 2 AOS-CX Health Checker")
parser.add_argument("-H", "--host", required=True, help="Switch IP/FQDN")
parser.add_argument("-u", "--user", required=True, help="API Username")
parser.add_argument("-p", "--password", required=True, help="API Password")
args = parser.parse_args()
check_cx(args.host, args.user, args.password)# 실행 권한 부여
sudo chmod +x /usr/lib/nagios/plugins/check_aoscx_health.pyStep 3. Icinga 2 CheckCommand 정의
작성한 Python 플러그인을 Icinga 2 커맨드 객체로 등록합니다.
sudo vi /etc/icinga2/conf.d/commands_aoscx.confobject CheckCommand "aoscx_rest_health" {
import "plugin-check-command"
command = [ PluginDir + "/check_aoscx_health.py" ]
arguments = {
"-H" = "$address$"
"-u" = "$aoscx_api_user$"
"-p" = "$aoscx_api_password$"
}
vars.aoscx_api_user = "$host.vars.aoscx_user$"
vars.aoscx_api_password = "$host.vars.aoscx_pass$"
}Step 4. Host 및 Service Apply Rule 정의
Icinga 2의 강력한 기능인 Apply Rule을 활용하여 os == "AOS-CX" 속성을 가진 모든 스위치에 자동으로 모니터링 서비스가 바인딩되도록 구성합니다.
sudo vi /etc/icinga2/conf.d/hosts_switches.conf✨ 모니터링 대상 장비의 IP주소(또는 FQDN)과 계정 정보, SNMP 정보를 알맞게 수정해서 입력합니다.
object Host "SW-CORE-01" {
  import "generic-host"
  address = "192.168.10.1"

  vars.os = "AOS-CX"
  vars.model = "CX6300"

  // REST API 자격 증명
  vars.aoscx_user = "icinga_mon"
  vars.aoscx_pass = "MyStrongPassword123!"

  // SNMPv3 자격 증명
  vars.snmp_v3 = true
  vars.snmp_v3_user = "icinga-snmp-user"
  vars.snmp_v3_auth_key = "AuthSecretKey123!"
  vars.snmp_v3_priv_key = "PrivSecretKey123!"
}sudo vi /etc/icinga2/conf.d/services_aoscx.conf// 1. SNMP 인터페이스 상태 점검 (1분 주기)
apply Service "SNMP-Interface-Status" {
import "generic-service"
check_command = "nwc_health"
vars.nwc_health_mode = "interface-usage"
check_interval = 1m
assign where host.vars.os == "AOS-CX"
}
// 2. REST API 심층 헬스 및 VSX 상태 점검 (3분 주기)
apply Service "REST-AOSCX-Health" {
import "generic-service"
check_command = "aoscx_rest_health"
check_interval = 3m
assign where host.vars.os == "AOS-CX"
}Step 5. 설정 검증 및 반영
# 설정 파일 문법 검증
sudo icinga2 daemon -C

# 검증 성공 시 데몬 리로드
sudo systemctl reload icinga25. 보너스: 무선 인프라(Controller/AP) 및 Aruba Central 확장 템플릿
동일한 아키텍처 규칙을 적용하면 무선 컨트롤러 및 Aruba Central 클라우드 환경도 손쉽게 관제 대상으로 확장할 수 있습니다.
1) Aruba Mobility Controller / AP 모니터링 (hosts_aruba_wireless.conf)
object Host "MC-CAMPUS-01" {
import "generic-host"
// 1) 컨트롤러 또는 IAP Virtual Controller(VIP) IP (필수)
address = "192.168.20.10"
vars.os = "ArubaOS-Wireless"
vars.role = "Mobility-Controller"
// 2) SNMP 커뮤니티 스트링 또는 SNMPv3 자격증명 (필수)
// SNMPv2c 사용 시:
vars.snmp_community = "내_SNMP_커뮤니티명"
// SNMPv3 사용 시:
// vars.snmp_v3 = true
// vars.snmp_v3_user = "icinga-snmp-user"
// vars.snmp_v3_auth_key = "AuthSecretKey123!"
// vars.snmp_v3_priv_key = "PrivSecretKey123!"
}2) Aruba Central Cloud API 연동 (hosts_aruba_central.conf)
Step 1. Central REST API 커스텀 플러그인 작성
sudo vi /usr/lib/nagios/plugins/check_aruba_central.py#!/usr/bin/env python3
import sys
import argparse
import requests
def check_central(api_host, token):
url = f"https://{api_host}/monitoring/v2/aps"
headers = {
"Authorization": f"Bearer {token}",
"Content-Type": "application/json"
}
try:
# Central AP 인벤토리 및 상태 조회
res = requests.get(url, headers=headers, params={"limit": 50}, timeout=10)
if res.status_code == 401:
print("CRITICAL - Central API Token Expired or Invalid")
sys.exit(2)
elif res.status_code != 200:
print(f"WARNING - Central API Error: HTTP {res.status_code}")
sys.exit(1)
data = res.json()
aps = data.get("aps", [])
total_aps = len(aps)
down_aps = [ap.get("name", "Unknown") for ap in aps if ap.get("status") != "Up"]
if down_aps:
print(f"CRITICAL - {len(down_aps)} AP(s) Down: {', '.join(down_aps[:3])}...")
sys.exit(2)
print(f"OK - All {total_aps} AP(s) Up and healthy on Central")
sys.exit(0)
except requests.exceptions.RequestException as e:
print(f"CRITICAL - Connection to Central failed: {str(e)}")
sys.exit(2)
if __name__ == "__main__":
parser = argparse.ArgumentParser()
parser.add_argument("-H", "--host", required=True, help="Central API FQDN")
parser.add_argument("-T", "--token", required=True, help="Central Bearer Token")
args = parser.parse_args()
check_central(args.host, args.token)sudo chmod +x /usr/lib/nagios/plugins/check_aruba_central.pyStep 2. Icinga2 명령어 정의
sudo vi /etc/icinga2/conf.d/commands_central.confobject CheckCommand "aruba_central_api_check" {
import "plugin-check-command"
command = [ PluginDir + "/check_aruba_central.py" ]
arguments = {
"-H" = "$address$"
"-T" = "$central_api_token$"
}
}Step 3. 호스트 및 서비스 등록 – 토큰 및 주소 입력
sudo vi /etc/icinga2/conf.d/hosts_aruba_central.confobject Host "Aruba-Central-Cloud" {
import "generic-host"
// 1) 리전별 Central API 게이트웨이 FQDN (필수)
// (예: 한국/아시아: apigw-apaceast.central.arubanetworks.com 등 본인 계정 리전 주소)
address = "https://apigw-apaceast.central.arubanetworks.com"
vars.platform = "Aruba-Central"
// 2) Central 고객 계정 ID (Customer ID)
vars.central_customer_id = "12345678"
// 3) Central API Gateway에서 발급받은 Bearer Token (필수)
vars.central_token = "eyJhbGciOiJSUzI1NiIsInR5cCI6..."
}API Gateway 주소 목록 (https://developer.arubanetworks.com/central/docs/api-oauth-access-token)
Step 4. 설정 검증 및 반영
# 설정 파일 문법 검증
sudo icinga2 daemon -C

# 검증 성공 시 데몬 리로드
sudo systemctl reload icinga26. 마무리 및 다음 편 예고
이번 1편에서는 Zabbix와의 핵심 차이점을 바탕으로, AOS-CX 스위치를 SNMPv3와 REST API로 결합하여 Icinga 2에 연동하는 기본 파이프라인을 완성했습니다.
다음 [2편: 심화 실전편]에서는 한 단계 더 나아가 엔터프라이즈 운영 효율을 극대화하는 주제들을 다룹니다.
- Icinga Director & Template Engine: 웹 UI 기반 대규모 스위치 일괄 등록
- Aruba Central 모니터링 항목 확장: Performance Data 기반 텔레메트리 확장
- Grafana & InfluxDB 연동: 트래픽 및 하드웨어 텔레메트리 시계열 대시보드 시각화
- AOS-CX NAE Webhook 연동: 스위치 내부 이상 징후 발생 시 실시간 푸시(Passive Check) 관제
- Ansible & EventCommand: 신규 장비 자동 등록 및 장애 발생 시 Self-Healing 연동 파이프라인