As IT infrastructure complexity increases, more and more devices are being connected to networks.
Network operators face the biggest challenge of figuring out what equipment is connected where and what it does.
For this reason, many observability solutions are being introduced to provide visibility and visualization.
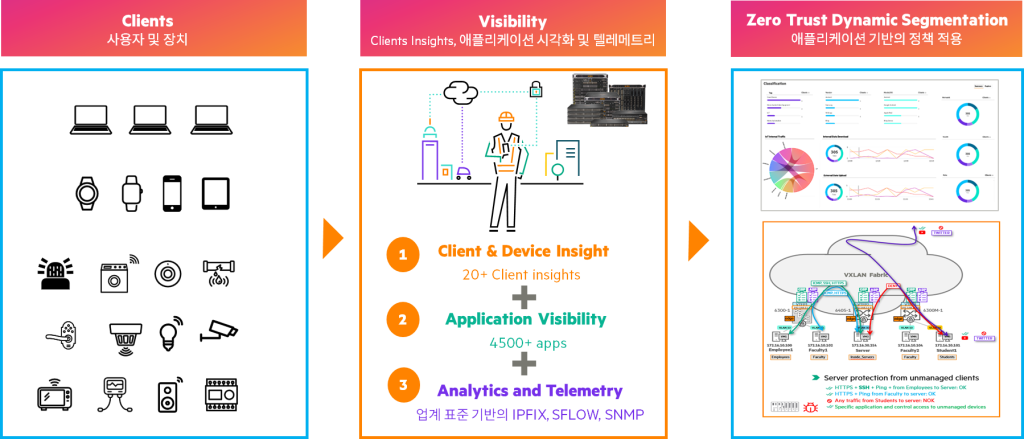
Today, we're introducing a feature that provides visibility into network traffic and provides application insights from traffic generated in wired environments, without requiring the implementation and deployment of a separate solution.
HPE Aruba Networking AOS-CX switches provide the ability to gain insights into applications and define security policies.
- Client Insight: Built-in with the Foundation License of HPE Aruba Networking Central (CNX)
- Application Recognition (AR): Built-in with the Foundation License of HPE Aruba Networking Central (CNX)
- Application Recognition & Control (ARC): CX Advanced License or Advanced License from Central (CNX)
- Traffic Insight (TI): No separate license required
- IPFIX: No separate license required
- Edge Insight: One of the ARC features
Client Insight
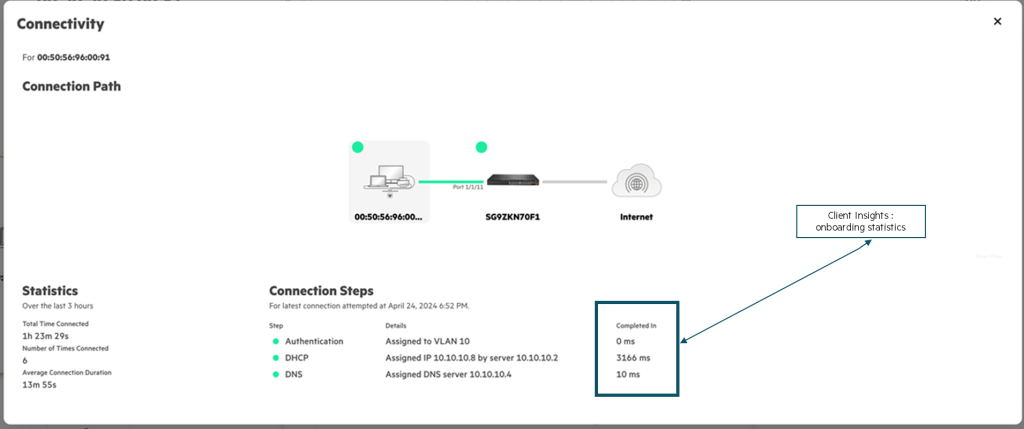
The Client Insight feature aims to capture the L2, L3, and L4 stage onboarding details of a client.
Details displayed through the Client Insight feature are used in Central to provide better insights.
- L2: The client is authenticated/authorized.
If security is disabled on the port, the client is treated as an L2 onboarded client. - L3: The client obtains an IP address through the DHCP process.
- L4: The client is accessing a DNS service to resolve a DNS name.
IPFIX and TI Monitor app types dns-onboarding-latency and dns-average-flows must be enabled.
DNS on-boarding and DNS average-latency features are not supported on the CX 6200.
switch# diag-dump client-insight basic
=========================================================================== [Start] Feature client-insight Time : Wed May 5 15:45:34 2022 ============================================================================ ------------------------------------------------------------------------- [Start] Daemon client-insightd ------------------------------------------------------------------------- Feature client-insight: Global client-insight = ENABLED Client on-boarding event logs = ENABLED Displaying client entries with (mac) as key. Total number of entries: 3 MAC : 00:11:01:00:00:08 ----------------------- Overall on-boarding status : - Overall on-boarding failure reason : - L2 on-boarding detail --------------------- L2 on-boarding status : successful L2 on-boarding failure reason : - L2 authentication start time : 05/18/22 15:01:01.456789 UTC L2 authentication end time : 05/18/22 15:01:02.123456 UTC L2 authentication latency : 0 min, 0 sec, 666667 us 802.1x RADIUS latency : - MAC-Auth RADIUS latency : 0 min, 0 sec, 332456 us L3 on-boarding detail ---------------------- L3 on-boarding status : in_progress L3 on-boarding failure reason :- L3 on-boarding latency : - VLAN : 10 ----------- IP details ---------- IPv4 on-boarding status : successful IPv6 on-boarding status : - DHCPv4 DHCPv6 ------ ------ Status : successful Status : - Failure reason : - Failure reason : - Start time : 05/18/22 15:01:02.456789 UTC Start time : - End time : 05/18/22 15:01:02.999988 UTC End time : - VLAN : 20 ----------- IP details ---------- IPv4 on-boarding status : In_Progress IPv6 on-boarding status : - DHCPv4 DHCPv6 ------ ------ Status : In_Progress Status : - Failure reason : - Failure reason : - Start time : 05/18/22 15:01:03.256485 UTC Start time: - End time: - End time: - DNS details ----------- Server IP: 172.16.1.8 --------------------- Average latency : 0 min, 0 sec, 432456 us DNS start time for latency calculation : 05/18/22 15:01:03.123456 UTC DNS end time for latency calculation : 05/18/22 15:01:03.425466 UTC Number of DNS requests : 16 Server IP: 2003::1 --------------------- Average latency : 0 min, 0 sec, 432456 us DNS start time for latency calculation : 05/18/22 15:01:03.123456 UTC DNS end time for latency calculation : 05/18/22 15:01:03.425466 UTC Number of DNS requests : 16 MAC : 00:11:01:00:00:09 ----------------------- Overall on-boarding status : failed Overall on-boarding failure reason : l2_onboarding_failed Authentication details ----------------------- L2 on-boarding status : auth_failed L2 on-boarding failure reason : server-reject L2 authentication start time : 05/18/22 15:01:01.456789 UTC L2 authentication end time : - L2 authentication latency : - 802.1x RADIUS latency : - MAC-Auth RADIUS latency : - L3 on-boarding detail ---------------------- L3 on-boarding status : in_progress L3 on-boarding failure reason : - L3 on-boarding latency : - VLAN : 2 ----------- IP details ---------- IPv4 on-boarding status : in_progress IPv6 on-boarding status : - DHCPv4 DHCPv6 ------ ------ Status: in_progress Status : - Failure reason : - Failure reason : - Start time : 05/18/22 15:01:02.436485 UTC Start time : - End time : - End time : - DNS details ----------- No Servers MAC : 00:11:01:00:00:1a ----------------------- Overall on-boarding status : successful Overall on-boarding failure reason : - Authentication details ---------------------- L2 on-boarding status : successful L2 on-boarding failure reason : - L2 authentication start time : 05/18/22 15:01:01.456789 UTC L2 authentication end time : 05/18/22 15:01:02.153785 UTC L2 authentication latency : 0 min, 0 sec, 696996 us 802.1x RADIUS latency : - MAC-Auth RADIUS latency : 0 min, 0 sec, 193946 us L3 on-boarding detail ---------------------- L3 on-boarding status : successful L3 on-boarding failure reason : - L3 on-boarding latency : 0 min, 0 sec, 565638 us VLAN : 2 ----------- IP details ---------- IPv4 on-boarding status : successful IPv6 on-boarding status : - DHCPv4 DHCPv6 ------ ------ Status : successful Status : - Failure reason : - Failure reason : - Start time : 05/18/22 15:01:02.436485 UTC Start time : - End time : 05/18/22 15:01:03.002123 UTC End time : - DNS details ----------- Server IP: 172.16.1.8 --------------------- Average latency : 0 min, 0 sec, 293946 us DNS start time for latency calculation : 05/18/22 15:01:03.436485 UTC DNS end time for latency calculation : 05/18/22 15:06:03.436485 UTC Number of DNS requests : 16 -------------------------------------------------------------------------- [End] Daemon client-insightd -------------------------------------------------------------------------- =========================================================================================== [End] Feature client-insight ========================================================================== Diagnostic-dump captured for feature client-insight
When you check client information in the next-generation Central, CNX, you can see Insights like the screen below.
The command to enable Client Insight on the CX switch is:.
switch(config)# client-insight enableYou can generate an event log listing the onboarding status of each client.
Onboarding event logs are disabled by default.
For the Onboarding event log to work, you must enable the Client Insight feature before onboarding a client.
switch(config)# client-insight event-log client-onboardingApplication Recognition (AR)
AOS-CX switches feature an L7-based packet inspection engine called Deep Packet Inspection (DPI).
AR or ARC functionality is required to recognize applications in traffic passing through the switch.
QOSMOS DPI EngineWe use this to identify information such as:.
- Flow-specific information for L7 content: src-ip, dst-ip, src-port, dst-port, etc.
- Application information: application id, application name, category, etc.
- TLS information: certificate cipher, TLS version, server name, etc.
Application awareness only works on wired switch ports and targets only TCP/UDP-based unicast traffic over IPv4/IPv6.
As of AOS-CX 10.15, 4,500 applications can be identified across 22 categories.
ARC is not supported on Link Aggregation Groups (LAG), Multi-Chassis LAGs (MCLAG), Route Only Ports (ROPs), and Switch Virtual Interfaces (SVIs).
So, let's see why this feature is necessary and how it differs from the existing method.
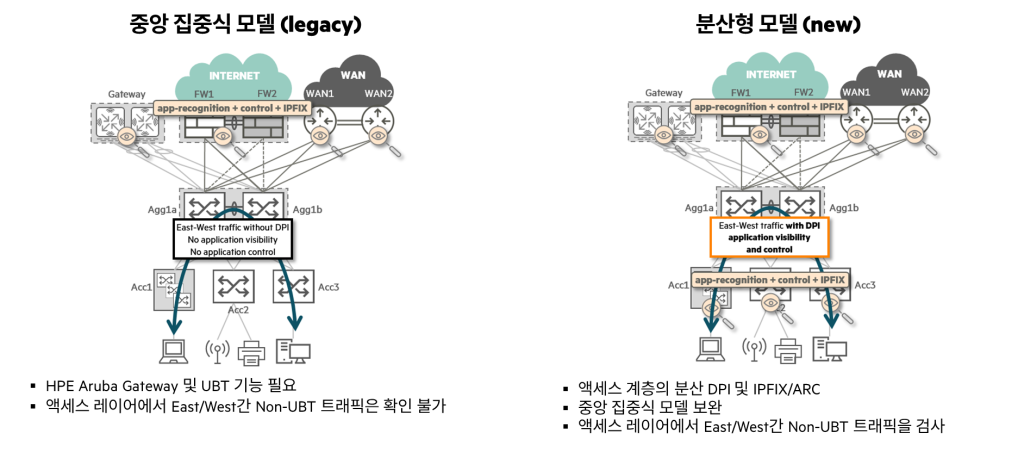
As shown in the figure above, the existing application recognition method could only identify applications by utilizing the gateway (controller)'s DPI engine when configuring UBT tunneling between the switch and the gateway (controller). In other words, it could not identify traffic within the access layer, not traffic within the UBT environment.
However, once the access switch itself becomes aware of the application, identification becomes possible even without UBT tunneling configuration.
Not all CX switches support this feature.
Supported switch models are limited, and each model has different allowable traffic flows.
For more details AOS-CX Switch Guide DocumentPlease refer to .
Going further here Fast from CX 10.14 version Mode is updated It's done.
switch(config)# app-recognition
switch(config-app-recognition)# mode
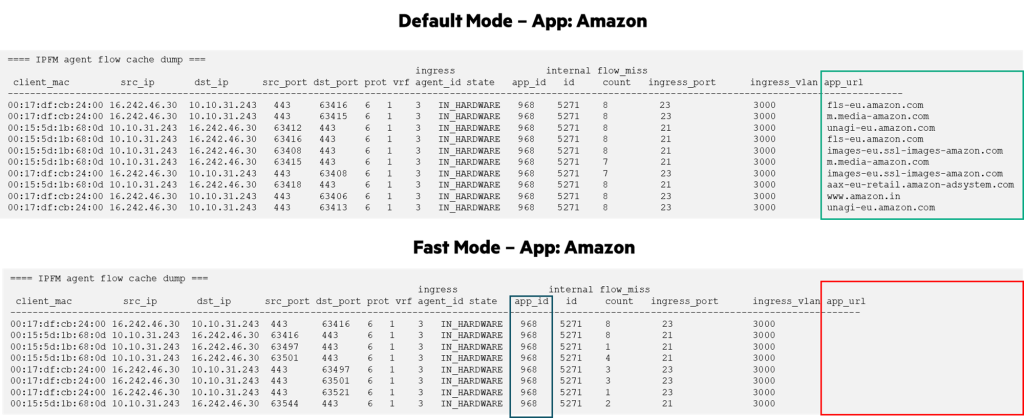
  default Process additional packets to get URL and TLS attribute. fast Relies on first packet classification to get only APP name and category.
Fast Mode is a hybrid of two modes of operation.
- If the application is already known, the packet is not sent to the CPU.
- In some cases, First Packet Classification (FPC) is utilized.

To quickly identify, we do not check TLS attribute values, etc., but only check the application-id, name, and category.
In Default mode, about 7 packets are required for identification, but in Fast mode, less than 4 packets are sufficient.
That is, it brings a performance improvement of more than 25% because it identifies less than 2 packets excluding SYN/ACK.
Instead, we cannot verify the App URL because we do not check the TLS information.
To enable App Recognition, first free up space in the hash table.
This step is required to enable the Flow Tracking feature, which must be enabled for ARC to function properly.
switch(config)# no ip source-lockdown resource-extended
switch(config)# flow-tracking
switch(config-flow-tracking)# enable
Now enable the App Recognition feature.
To enable the feature across the switch, enter the command as follows:.
switch(config)# app-recognition
switch(config-app-recognition)# enable
To enable it only for specific interfaces or specific roles, configure it as follows:.
switch(config)# int 1/1/1
switch(config-if)# app-recognition enable
switch(config)# port-access role employee
switch(config-pa-role)# app-recognition enableThe App Recognition feature should not be used on uplink or LAG interfaces other than access ports.
AR functionality is interrupted during ISSU (In-Service Software Upgrade).
IPFIX
IPFIX (IP Flow Information Export) is an IETF standard for exporting traffic flow information from network devices.
Because it collects information without sampling and with low resources, it is used for tasks such as demand forecasting, billing, and security analysis.
The IPFIX monitoring solution consists of:.
- IPFIX Exporter: Run on network devices such as switches and routers to generate and export information.
- IPFIX Collector: Receive monitoring information from IPFIX Exporter
IPFIX can be defined as two Flow Records: Match Field and Collect Field.
- Match Field: Tuple data in IPv4 or IPv6 (source/destination IP, source/destination port, protocol)
- Collect Field: Non-Key field that specifies the flow information to be collected
(Flow volume (byte or packet), Flow start/end time, application name, DNS response code, egress interface/queue/VLAN, forwarding status, http-request-destination, TLS properties, etc.)
CX switches support ingress direction and IPv4/IPv6, unicast/multicast traffic, ICMP, etc. depending on the model.
Although IPFIX and sFlow may seem similar in that they both obtain traffic flow information, they have the following differences:.
| sFlow | IPFIX |
|---|---|
| Flow sampling technology (1 out of n packets) | No sampling (all packets in that flow are counted) |
| Does not report flow duration | Provides Flow duration |
| Sample includes datagram (up to 9,000 byte payload) | You can specify exclusive information (AppID) in Flow and export it to Collector. |
| No URL tracking | Allow variable-length fields to export information such as URLs |
| No ASIC table resource usage | ASIC resource usage |
| CPU intensive points (protected by CoPP) | Not CPU intensive |
Data Center IPFIX (CX 10.14+)
For CX 6200/6300/6400, CX 8360 including CX 8325 switch Configuring IPFIX in a port-based mannerdo.
Instead of TCAM (Ternary Content-Addressable Memory), Flow data is stored in EM (Exact Match) tables.
TCAM is a highly sought-after resource shared across multiple protocols, including security protocols.
So IPFIX flow is detected, but it is stored in another table called EM table.This EM table is used by other features such as L2, L3, and multicast to achieve the scale of that feature.

Supports Traffic Insight for TopN and Flow information, and supports up to 32,000 IP Flow data.
Campus IPFIX (CX 6200/6300/6400 10.14+)
The product families in the campus portfolio, such as the CX 6200/6300/6400, are not port-based. Role-based behaviordo.
Using IP Flow Table instead of TCAM provides better scalability regardless of IP version.
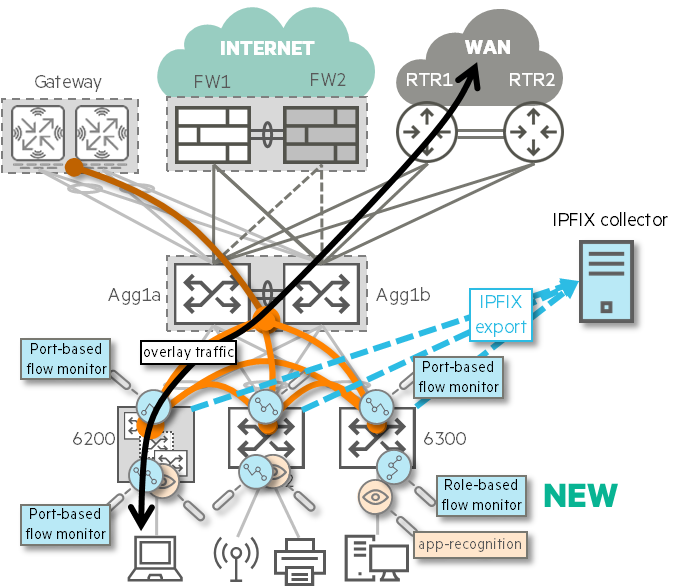
Port-based approach is preferred over role-based approach in CX 8325.
And it supports LUR (Local-user-role), DUR (Downloadable-user-role), and terminal profiles.
The IPFIX scale for each CX switch model is as shown in the table below.
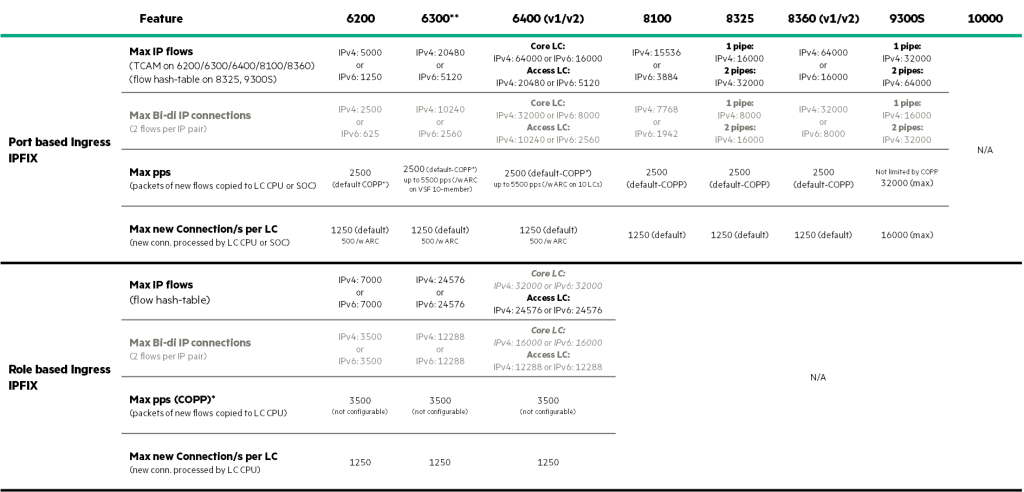
To configure IPFIX on a CX switch, you can configure it with the command as follows.
First, create a Flow Record for collection.
switch(config)# flow record flowRecordv4
switch(config-flow-record)# match ip protocol
switch(config-flow-record)# match ip source address
switch(config-flow-record)# match ip destination address
switch(config-flow-record)# match ip version
switch(config-flow-record)# match transport destination port
switch(config-flow-record)# match transport source port
switch(config-flow-record)# collect counter bytes
switch(config-flow-record)# collect counter packets
switch(config-flow-record)# collect application name
switch(config-flow-record)# collect timestamp absolute first
switch(config-flow-record)# collect timestamp absolute last
switch(config-flow-record)# collect application https url
And create a Flow exporter (Target).
switch(config)# flow exporter myTarget
switch(config-flow-exporter)# dest type hostname-or-ip-addr
switch(config-flow-exporter)# destination 1.2.3.4
----- switch(config)# flow exporter localTI ## For Traffic Insights
switch(config-flow-exporter)# export-protocol ipfix
switch(config-flow-exporter)# destination type traffic-insight
switch(config-flow-exporter)# destination traffic-insight TI
Create a Flow Monitor.
switch(config)# flow monitor myMonitorv4
switch(config-flow-monitor)# record flowRecordv4
switch(config-flow-monitor)# exporter myTarget
switch(config-flow-monitor)# exporter localTI
Finally, apply it to the interface or role.
switch(config)# int 1/1/1
switch(config-if)# app-recognition enable ## Optional
switch(config-if)# ip flow monitor myMonitorv4 in
switch(config-if)# ipv6 flow monitor myMonitorv6 in
switch(config)# flow-tracking
switch(config-flow-tracking)# enable
switch(config-flow-tracking)# Enable flow statistics
switch(config)# port-access role monitored
switch(config-pa-role)# app-recognition enable ## Optional
switch(config-pa-role)# ip flow monitor myMonitorv4
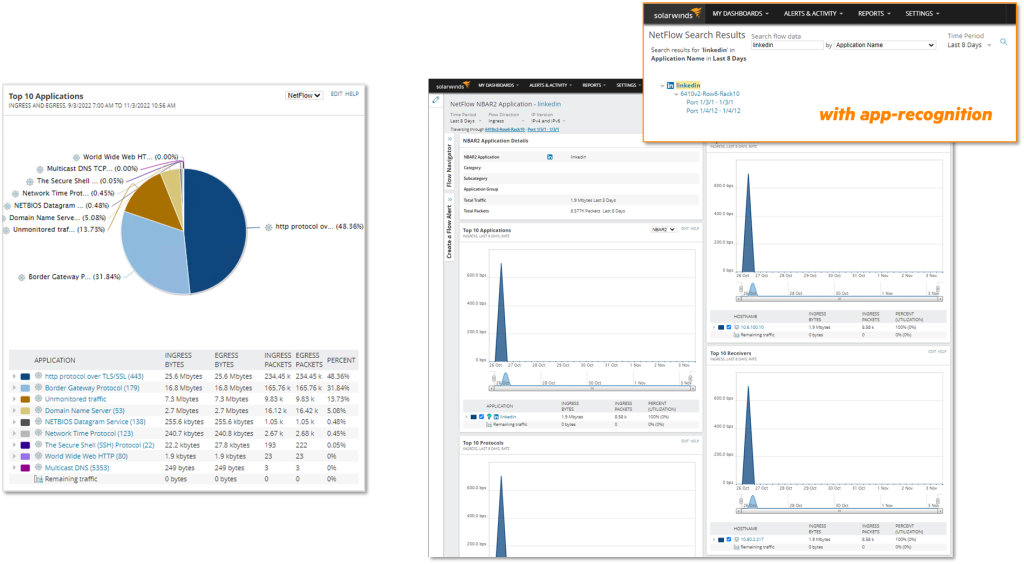
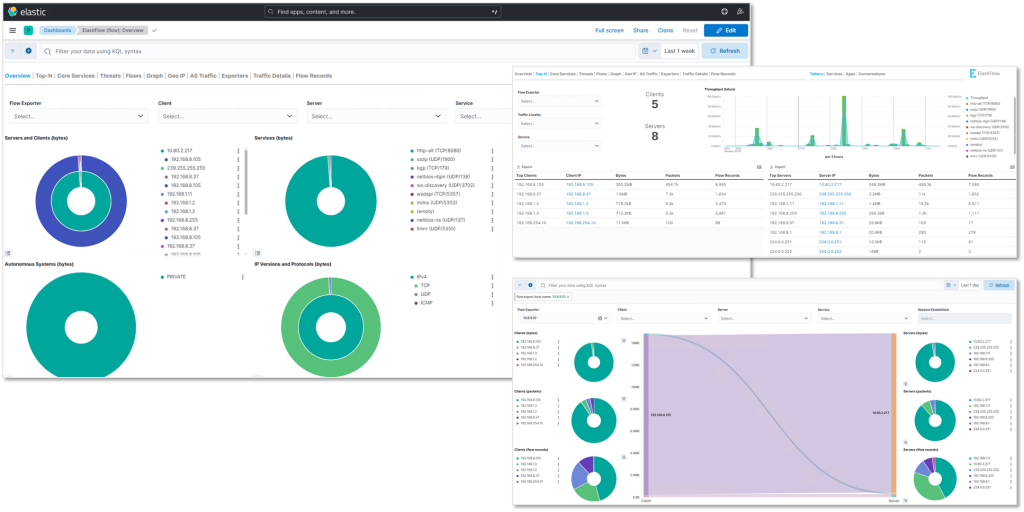
switch(config-pa-role)# ip flow monitor myMonitorv6IPFIX data can be integrated with various visualization solutions, as shown below.


Traffic Insight
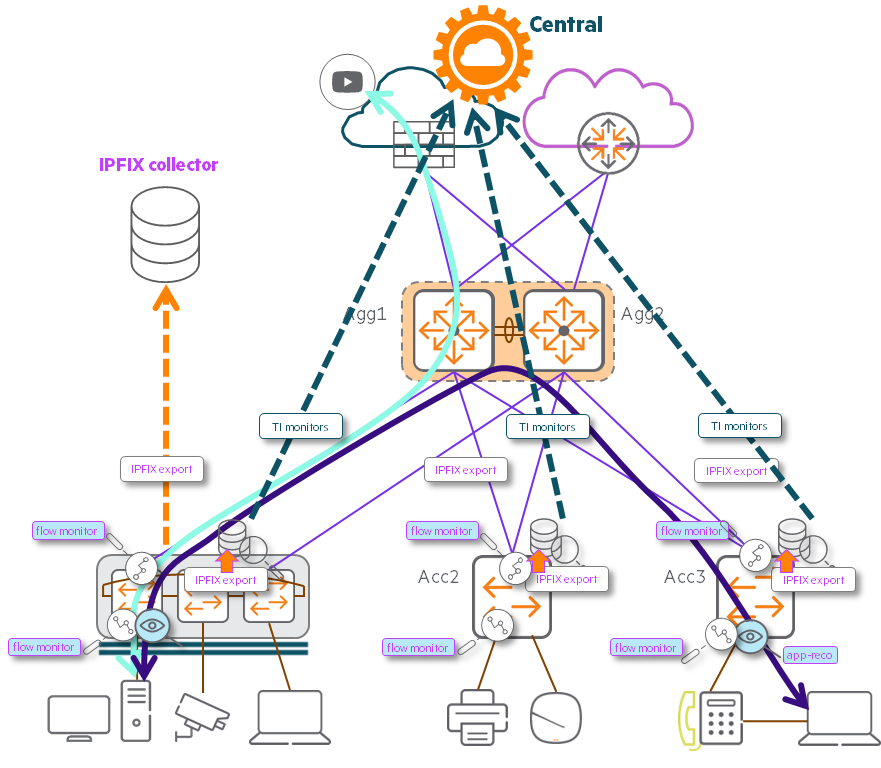
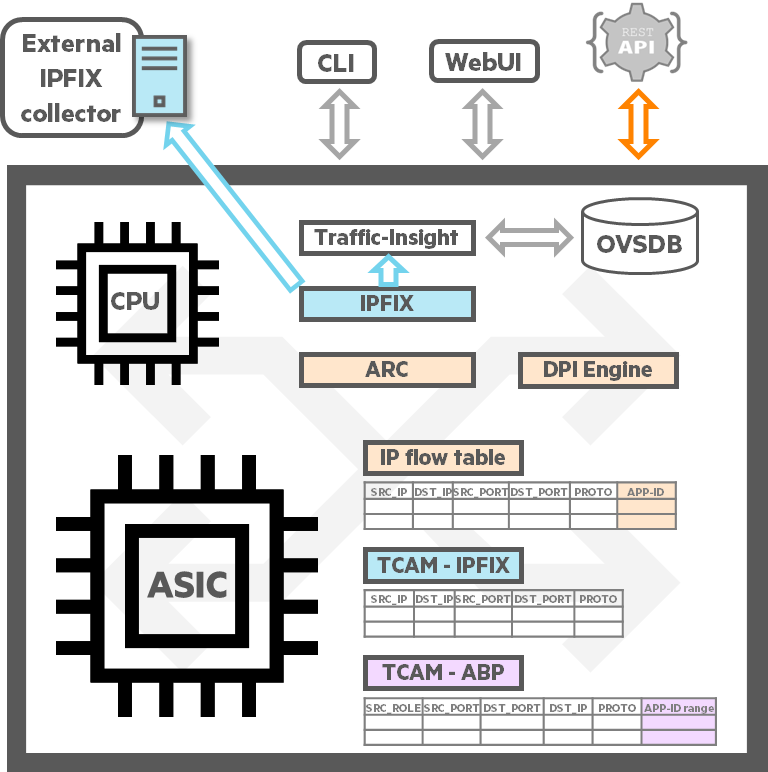
Traffic Insight (TI) acts as an IPFIX Collector within the CX switch.
Although you cannot receive IPFIX from an external Exporter, you will receive the same dataset as an external Collector.
Aggregate traffic flow data into the Open vSwitch Database (OVSDB).
This aggregated data is made available for analysis purposes through API, Central, CLI, etc.
TopN flow reports and visualizations in the switch's Web UI enable quick and easy monitoring and troubleshooting.
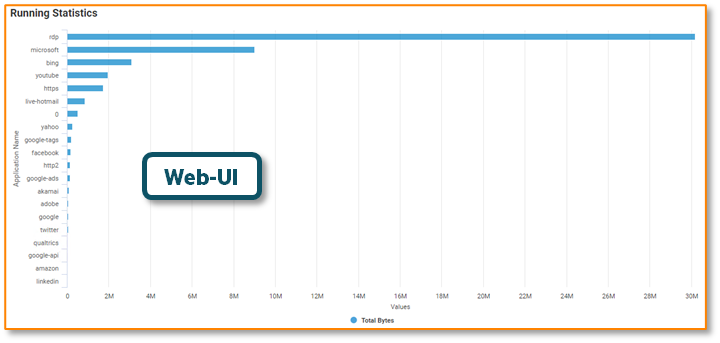
Traffic Insight can monitor the following types:.
- TopN Flow (5-20 per volume, every 5 minutes): Monitor IPv4/v6 traffic and capture top N volume flows (in bytes).
– Top-N Flow reports are generated once every 5 minutes and this timer cannot be changed.
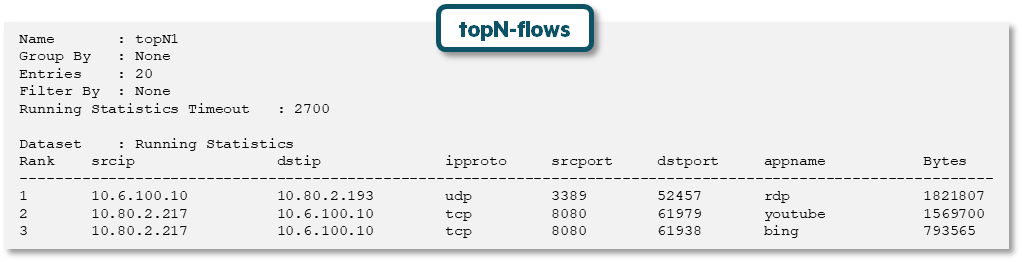
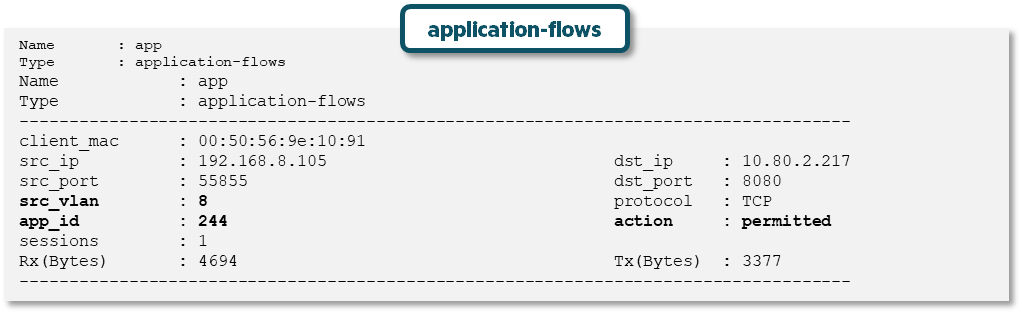
- Application Flow: Aggregate all Client-to-Server/Server-to-Client ingress flow data and merge them into a single flow.
– Provides Rx and Tx byte details
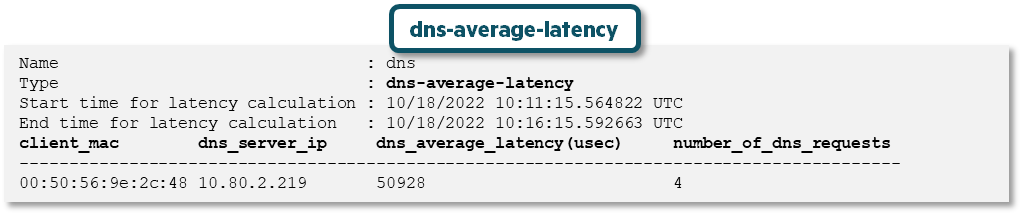
- dns-average-latency: Monitors DNS requests and responses and provides details on average DNS latency per client.
- Raw-Flows: Provides on-demand, one-way flow details for any app or client to CNX.
- dns-onboarding-latency: Monitor DNS requests and responses and provide onboarding DNS latency details per client.
- workload-flows: Monitors unicast traffic and provides transmission and reception counters and actions for that flow.
- dropped-flows: Monitor traffic flows that are dropped for various reasons.
Only the source of the local switch can be visualized using the exporter.
TopN's traffic is limited to a maximum of 20 applications.
During ISSU, losses occur and up to 2000 application flows are possible.
How to configure Traffic-Insight
To configure Traffic Insight, you need to set up Flow Exporter and Flow Record.
In the Flow Exporter item, select destination traffic-insightis defined as.
switch(config)# flow exporter TI
switch(config-flow-exporter)# description internal traffic-insight
switch(config-flow-exporter)# destination type traffic-insight
switch(config-flow-exporter)# destination traffic-insight TI1
Define the data to be recorded in the Flow by configuring the Match field and Collect field.
switch(config)# flow record REC4-1
switch(config-flow-record)# description collect all IPv4
switch(config-flow-record)# match ipv4 destination address
switch(config-flow-record)# match ipv4 protocol
switch(config-flow-record)# match ipv4 source address
switch(config-flow-record)# match ipv4 version
switch(config-flow-record)# match transport destination port
switch(config-flow-record)# match transport source port
switch(config-flow-record)# collect application name
switch(config-flow-record)# collect counter bytes
switch(config-flow-record)# collect counter packets
switch(config-flow-record)# collect timestamp absolute first
switch(config-flow-record)# collect timestamp absolute last
Flow Monitor records data from the network traffic of an interface as a flow record (REC4-1) is stored in the cache in the format defined in .
Then, the Flow Exporter connected to the monitor(TI) is in the flow cache as destination(TI1) to export data.
switch(config)# flow monitor MON4-1
switch(config-flow-monitor)# description IPv4 monitor
switch(config-flow-monitor)# cache timeout active 1800
switch(config-flow-monitor)# cache timeout inactive 30
switch(config-flow-monitor)# exporter TI
switch(config-flow-monitor)# record REC4-1
Enter the previously configured flow monitor on the interface on which you want to monitor traffic flow.
And also enable app-recognition.
switch(config)# interface 1/1/1
switch(config-if)# no shutdown
switch(config-if)# no routing
switch(config-if)# vlan access 11
switch(config-if)# ip flow monitor MON4-1 in
switch(config-if)# app-recognition enable
switch(config-if)# exit
Now we define the policies required to enable Traffic Insights.
We perform monitoring based on data obtained through Flow exporter and provide monitoring reports for each request.
switch(config)# traffic-insight TI1
switch(config-ti)# enable
switch(config-ti)# source ipfix
switch(config-ti)# monitor topN1 type topN-flows entries 20
switch(config-ti)# monitor topN3 type topN-flows entries 20 group-by appid
switch(config-ti)# monitor topN2 type topN-flows entries 20 group-by srcip_appid filter-by appid 240
switch(config-ti)# monitor app type application-flows
switch(config-ti)# monitor dns type dns-average-latency
When configuring Traffic Insight, you can only set up to 5 monitoring items, and only 1 app and 1 DNS each.
If you run the command above, you can check the monitoring information in the switch's Web UI as shown below.

And this information can also be found on New Central (CNX).
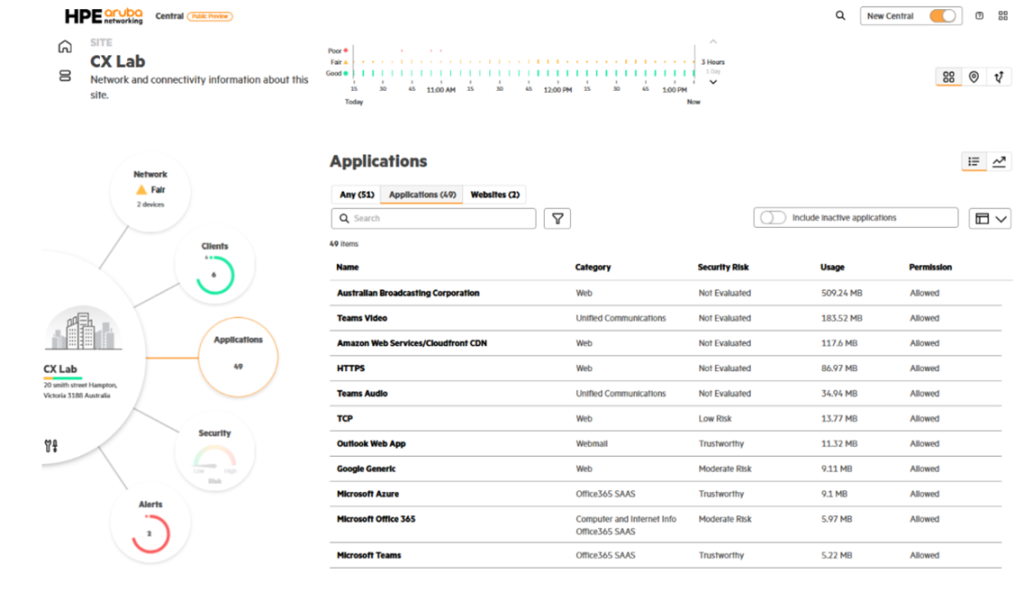

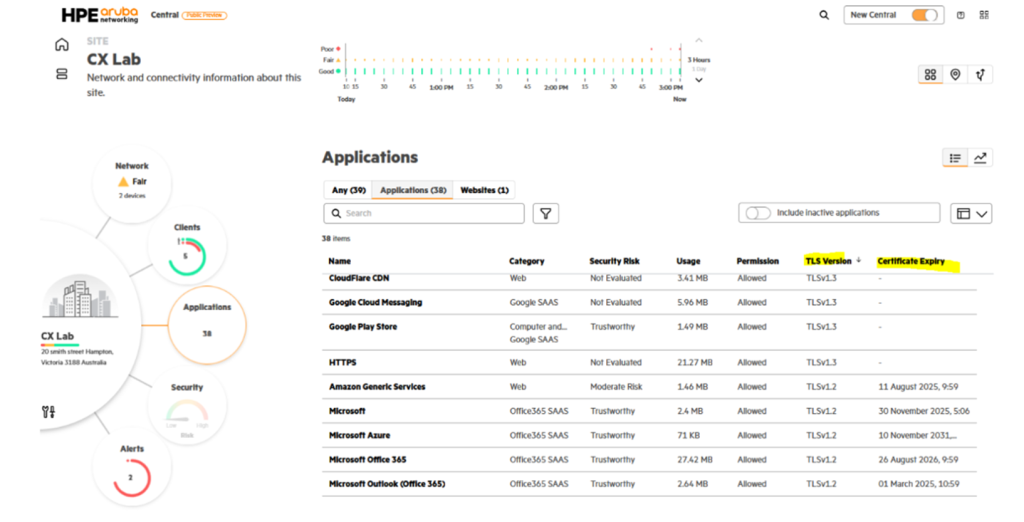
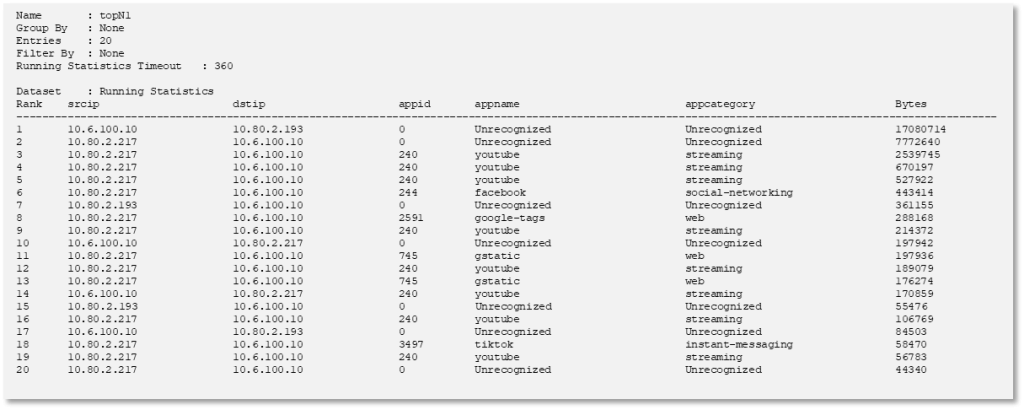
In CLI too show traffic-insight TI1 monitor-type topN-flows topN1 app-details You can check it through the command.
As mentioned earlier, as infrastructure complexity increases, security blind spots also tend to expand.
Minimizing these blind spots and giving administrators greater visibility is the only way to strengthen security.
Moreover, securing and improving visibility not only strengthens security but also facilitates troubleshooting.
That is, it is very important for modern networks to monitor traffic and determine the applications within the traffic.
Moving beyond the traditional approach of monitoring only external and internal traffic, a zero-trust environment requires monitoring internal traffic as well and understanding how it operates.
Configure observability using only the features of the AOS-CX switch without the need to build a separate solution.