

[MCP Practice] Unifying Cross-Domain Network Infrastructure
Previous post How to Use AI Smarter: MCP (Model Context Protocol)In this section, we examined the concept and necessity of MCP (Model Context Protocol), a standard protocol for LLM to go beyond simple chatbots and exchange data with external systems in real time.
“I understand the concept, but how can I apply it to my actual network operating environment?”
The question naturally follows.
The daily life of an engineer in the field is more fragmented than expected.
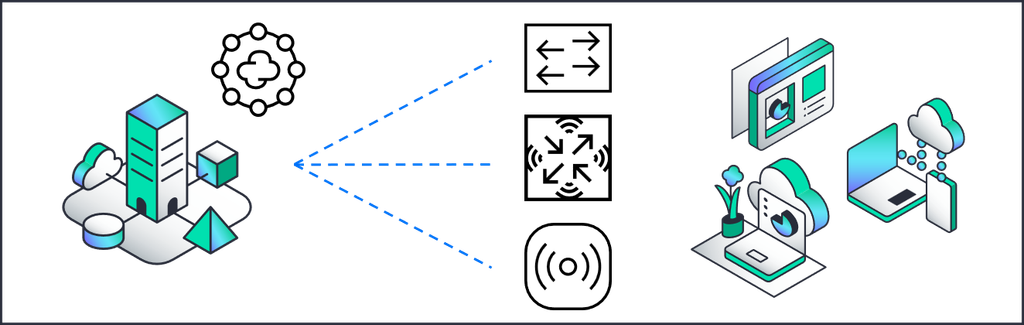
Campus wireless must be checked in Juniper Mist, wired switching in Aruba Central, authentication logs in ClearPass (CPPM), and data center fabrics in Juniper Apstra. When failure tickets or suspicious security events occur, crucial root cause analysis and decision-making are often pushed aside as users switch between multiple browser tabs to cross-reference logs.
In this article, we will break down these silos and open source projects hpe-networking-mcpWe introduce a practical implementation guide for integrated monitoring and analysis of enterprise infrastructure from a single chat window.
Before You Begin: Project Sources and Guide
The tool covered in this post is GitHub's open source project
nowireless4u/hpe-networking-mcpno see.
- Independent open source community project: This repository is not an official product or official support software of HPE, Aruba Networks, or Juniper Networks, An unofficial open-source tool developed by the communityno see.
- Caution when applying to operating environments: In enterprise environments, for system stability and audit trails, it is essential Read-Only API PermissionsWe recommend operating it composed solely of.
1. No separate UI: “The AI chat window I was using is the control console”
A common misconception when first encountering this project is, “Will a separate web dashboard or control monitoring screen be created?”.
To start with the conclusion, there is no built-in web UI at all.
hpe-networking-mcpIt is not a service with a user interface, but an API interpreter and bridge (Server Backend) running in the background.

- MCP server (
hpe-networking-mcp): It waits inside a Docker container, and when the AI queries using standard protocols, it plays the role of calling APIs of each platform (Mist, Central, ClearPass, UXI, etc.) in parallel to convert them into refined data. - User UI: The chat windows of AI clients that engineers use for their daily work (such as Claude Desktop, VS Code, GitHub, and Copilot Chat) become the control console.
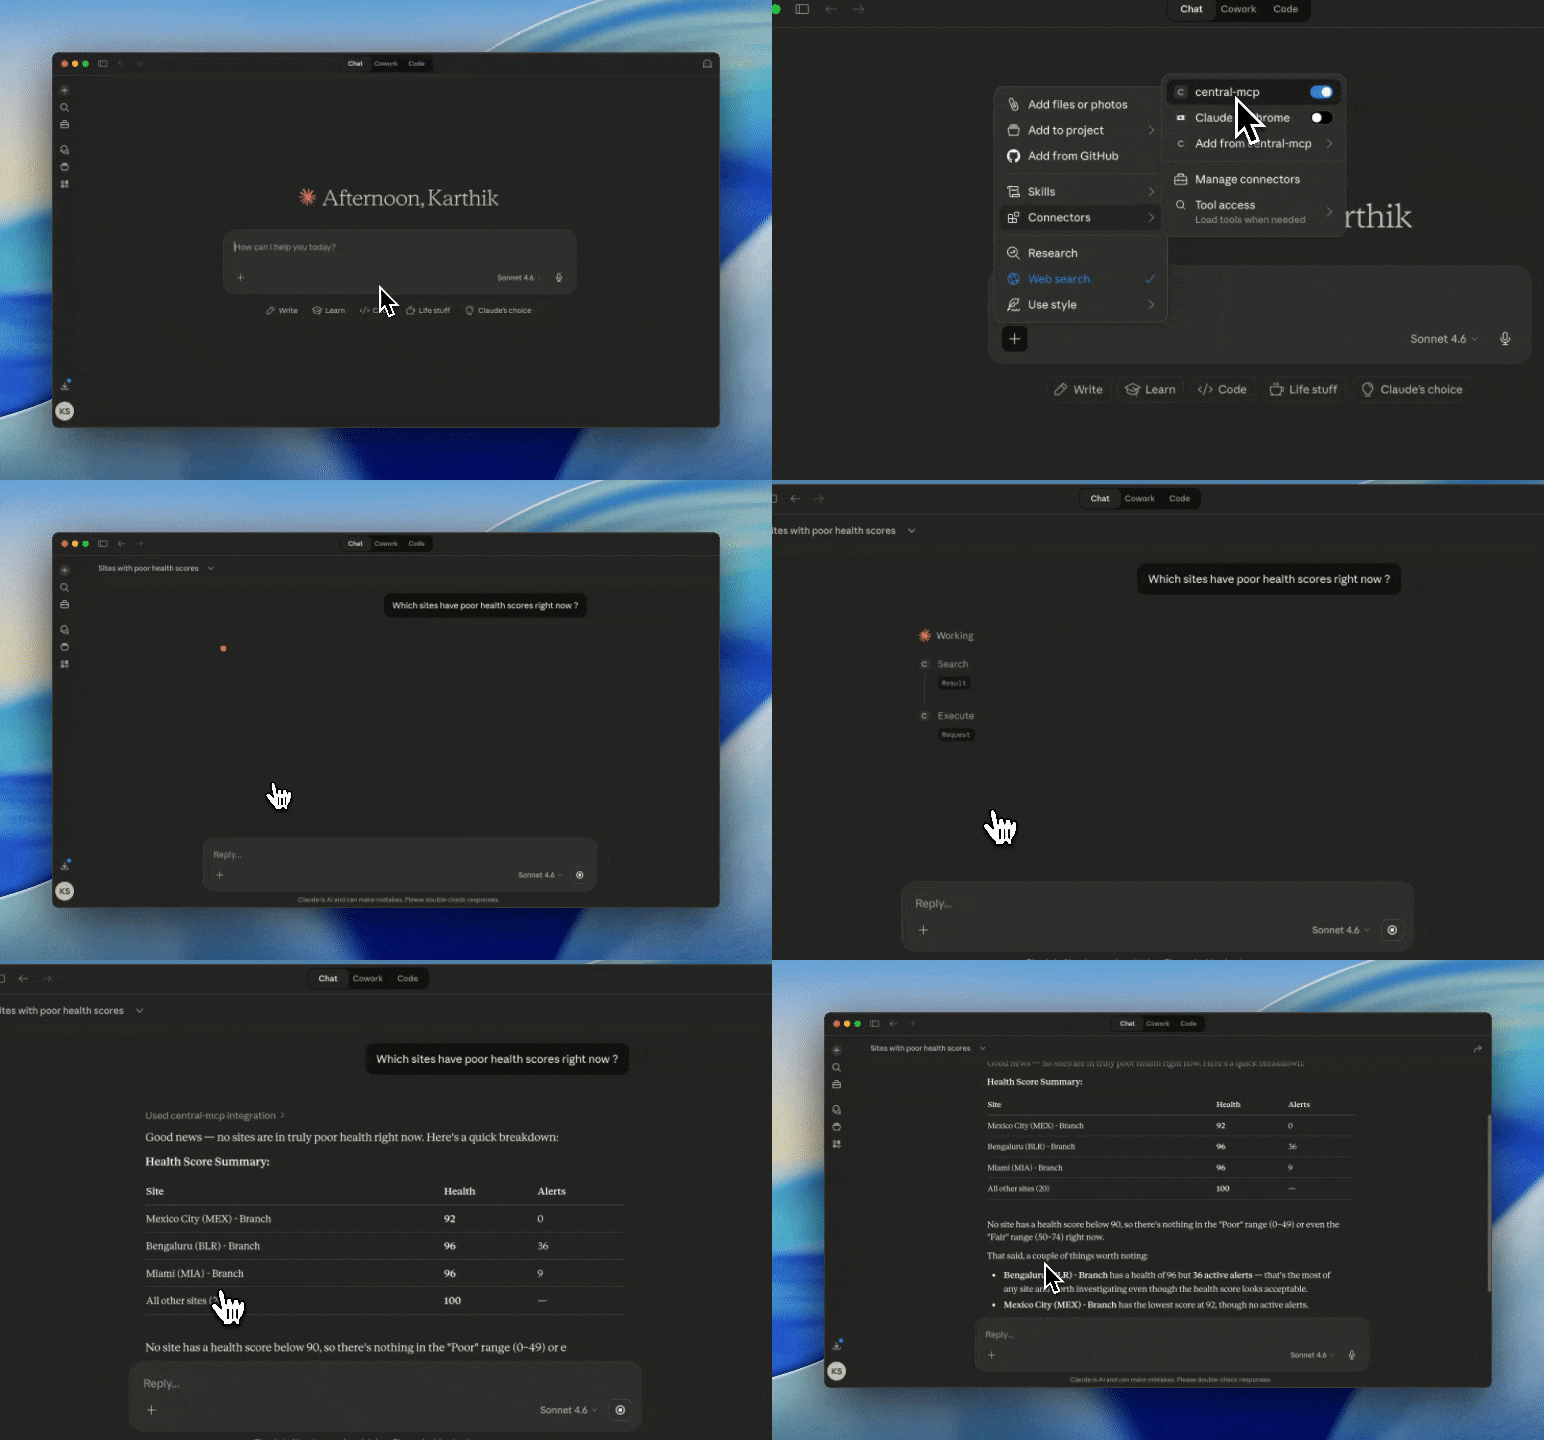
It operates with a structure that “adds an interface to the AI chat window I normally use, allowing it to communicate directly with network equipment,” without the need to launch a separate web server or a complex portal.
2. Why LLM MCP when there is vendor AIOps?
Mist's Marvisand Central's AI InsightsThey are very powerful within their respective domains. However, they are unaware of each other's circumstances.
- MarvisIt points out that response delays occurred in specific AP zones, but identifies the cause as the campus core switch (CentralWhether it is a bottleneck of ) data center leaf-spine fabric(ApstraIt does not check whether it is due to BGP session flapping.
- While each domain manager spends time verifying each section, saying, “Wireless is normal” and “There are no issues with the campus wired connection,” the MTTR (Mean Time to Recover) lengthens.
hpe-networking-mcpThe core value is Rather than replacing existing vendor AI, it weaves it together with a higher-level orchestrator.is in.
[Infrastructure Layer]   Mist (Marvis) Aruba Central ClearPass (NAC) Juniper Apstra (DC) │ │ │ │ (API Telemetry) (API Telemetry) (RADIUS Logs) (Blueprint/BGP Anomalies) └───────────────────┴─────────┬─────────┴────────────────────┘ ▼
[MCP Server]                              hpe-networking-mcp (single container) │ (standard MCP protocol) ▼
[Inference Engine]                     Claude Desktop / VS Code Copilot Chat → Identifying "Correlations" in Segmented Data from Campus to Data Center
Simultaneously retrieving the primary diagnostic data and raw telemetry that each solution has already analyzed, LLM derives end-to-end correlations from a holistic infrastructure perspectivedo.
3. Architecture Core: 4,000 Tools and Context Optimization
This project includes Mist (1,050+), EdgeConnect (1,216+), Central (669+), ClearPass (142), AOS8 (48), Axis Atmos (25), UXI (21), Apstra (19), etc. A total of over 4,100 detailed tools (API endpoints)It has built-in.
Support scope
| Category | Mist | Central | GreenLake | ClearPass | Apstra | Axis | AOS8 | UXI | EdgeConnect |
|---|---|---|---|---|---|---|---|---|---|
| Site Health & Performance Metrics | ✅ | ✅ | — | — | — | — | ✅ | ✅ | ✅ |
| WLANs / SSIDs | ✅ | ✅ | — | — | — | — | ✅ | — | — |
| Device Inventory | ✅ | ✅ | ✅ | ✅ | ✅ | ✅ | ✅ | ✅ | ✅ |
| Device Details (AP/Switch/GW) | ✅ | ✅ | — | — | — | — | ✅ | — | — |
| Device Stats & Utilization | ✅ | ✅ | — | — | — | ✅ | ✅ | ✅ | ✅ |
| Client Connectivity | ✅ | ✅ | — | — | — | — | ✅ | — | — |
| Events | ✅ | ✅ | — | ✅ | — | — | ✅ | — | — |
| Alerts / Alarms | ✅ | ✅ | — | ✅ | ✅ | — | ✅ | — | ✅ |
| Audit Logs | ✅ | ✅ | ✅ | ✅ | — | — | ✅ | — | ✅ |
| Application Visibility | ✅ | ✅ | — | — | — | ✅ | — | — | ✅ |
| Troubleshooting (Ping/Traceroute/Bounce) | ✅ | ✅ | — | — | — | — | ✅ | — | — |
| Session Control/Client Disconnect | ✅ | ✅ | — | ✅ | — | — | ✅ | — | — |
| Configuration Management | ✅ | ✅ | — | ✅ | ✅ | ✅ | ✅ | ✅ | ✅ |
| Configuration Write (CRUD) | ✅ | ✅ | — | ✅ | ✅ | ✅ | ✅ | ✅ | ✅ |
| Radio Resource Management | ✅ | — | — | — | — | — | ✅ | — | — |
| Rogue AP Detection | ✅ | ✅ | — | — | — | — | ✅ | — | — |
| Firmware Management | ✅ | ✅ | — | — | — | — | ✅ | — | ✅ |
| Subscriptions / Licensing | ✅ | — | ✅ | ✅ | — | — | ✅ | — | ✅ |
| User Management | ✅ | ✅ | ✅ | ✅ | — | ✅ | — | — | ✅ |
| Workspaces | — | — | ✅ | — | — | — | — | — | — |
| Scope & Configuration Hierarchy | ✅ | ✅ | — | — | — | ✅ | ✅ | — | — |
| Guest Management | ✅ | ✅ | — | ✅ | — | — | — | — | — |
| NAC / Policy Management | ✅ | ✅ | — | ✅ | — | — | — | — | — |
| Endpoint Profiling | ✅ | ✅ | — | ✅ | — | — | — | — | — |
| Certificates | ✅ | ✅ | — | ✅ | — | — | — | — | — |
| Webhooks | ✅ | ✅ | — | — | — | — | — | — | — |
| Reports / Scheduled Reports | ✅ | ✅ | — | ✅ | — | — | — | — | ✅ |
| Floor Plans / Sitemaps | ✅ | ✅ | — | — | — | — | — | — | — |
| BLE Asset Tracking / IoT Beacons | ✅ | ✅ | — | — | — | — | — | — | — |
| Marvis / AI Assistant | ✅ | — | — | — | — | — | — | — | — |
| Datacenter Blueprints / Templates | — | — | — | — | ✅ | — | — | — | — |
| Virtual Networks / EVPN / Routing Zones | — | — | — | — | ✅ | — | — | — | — |
| Connectivity Templates/Policy Apply | — | — | — | — | ✅ | — | — | — | — |
| Fabric Deploy / Diff Status | — | — | — | — | ✅ | — | — | — | — |
| BGP/Protocol Session Monitoring | — | — | — | — | ✅ | — | — | — | — |
| SASE Cloud Connectors/Tunnels | — | — | — | — | — | ✅ | — | — | — |
| URL / Web Category Filtering | — | — | — | — | — | ✅ | — | — | — |
| SSL Inspection Exclusions | — | — | — | — | — | ✅ | — | — | — |
| Staged Writes + Commit Workflow | — | — | — | — | ✅ | ✅ | — | — | — |
| Guided Prompts | ✅ | ✅ | — | — | — | — | ✅ | — | — |
| Dynamic Tool Discovery | ✅ | ✅ | ✅ | ✅ | ✅ | ✅ | ✅ | ✅ | ✅ |
| Underlying tools | 1050 + 2 prompts | 669 + 12 prompts | 10 | 142 | 19 | 25 | 48 + 9 prompts | 21 | 1216 |
| Exposed meta-tools (dynamic mode) | 3 | 3 | 3 | 3 | 3 | 3 | 3 | 3 | 3 |
| Cross-Platform | 3 tools + 3 prompts | 3 tools + 3 prompts | — | 1 tool | — | — | — | — |
If you register the JSON schemas of 4,100 tools directly to the LLM like a typical MCP server, hundreds of thousands of tokens will be consumed before a conversation even starts, causing the context window to be exceeded or the LLM to become confused among the numerous tools.
To solve this, this project (v3.0+) is MCP_TOOL_MODE=codeWe adopted the architecture as the default.
Core operating principles of Code Mode
Instead of directly showing 4,100 individual tools to the LLM, it exposes only 6 meta-tools for exploration and execution.
| Exposed meta tools | Roles and Functions |
tags | By platform/by function (e.g.: mist, central, apstra, wlanView list of tool category tags classified as ). |
search | Search for the names and brief descriptions of necessary sub-tools using keyword or tag combinations |
get_schema | Pinpoint query only the exact parameter specifications (JSON Schema) required to call a specific searched tool. |
execute | In an isolated sandbox Python environment await call_tool(name, params)Execute to call and process multiple APIs at once |
skills_list / skills_load | View and load a list of predefined multi-step troubleshooting procedures (Markdown workflows). |
Why is Code Mode efficient?
- Minimize initial context cost: Initial prompt token consumption is minimized because only 6 meta tools are registered instead of 4,100 schemas.
- Single-turn processing of multiple API calls (Looping in Sandbox): For example, if a request comes in saying, “Gather and summarize all campus site status and data center blueprint anomalies,” the LLM can [do] without the need for the LLM and MCP servers to make dozens of round trips.
executeWrite a short Python script inside the tool and throw it. After parallel calling and filtering multiple platform APIs inside the container, Return only the final summary result to LLMdo. - Unified Response Envelope: Regardless of which platform's tool is called, the result is
{ok, status, data, message, tool, platform}It is returned wrapped in a consistent JSON structure, so it blocks AI parsing errors.
4. Practical deployment and .env File organization method
The setup is handled with a single Docker container.
Step 1. Clone the repository and prepare environment variables
git clone https://github.com/nowireless4u/hpe-networking-mcp.git
CD hpe-networking-mcp
cp .env.example .env
Step 2. .env Detailed file configuration (disabling unused solutions and lightweighting)
.env The most important principle when configuring files is to “fill only the solutions you use and leave the unused ones empty.”.
Platforms with empty key values are automatically disabled from tool registration when the container starts, which can significantly save memory and initialization speed.
# ==========================================
# 1. MCP Server Default Operation Mode (Token Optimization)
# ==========================================
MCP_TOOL_MODE=code

# ==========================================
# 2. Campus Wired/Wireless: Juniper Mist & Aruba Central
# ==========================================
MIST_API_TOKEN=your_mist_readonly_api_token
MIST_HOST=api.mist.com

CENTRAL_BASE_URL=https://apigw-apne.central.arubanetworks.com
CENTRAL_CUSTOMER_ID=your_customer_id
CENTRAL_CLIENT_ID=your_client_id
CENTRAL_CLIENT_SECRET=your_client_secret

# ==========================================
# 3. Data Center Fabric: Juniper Apstra (Optional)
# ==========================================
APSTRA_URL=https://apstra.yourdomain.local
APSTRA_USERNAME=apstra_readonly_user
APSTRA_PASSWORD=your_apstra_password

# ==========================================
# 4. Certification and Quality of Experience: ClearPass & HPE UXI (Optional)
# ==========================================
CLEARPASS_SERVER=cppm.yourdomain.local
CLEARPASS_CLIENT_ID=your_oauth_client_id
CLEARPASS_CLIENT_SECRET=your_oauth_client_secret

UXI_APP_KEY=your_uxi_app_key
UXI_APP_SECRET=your_uxi_app_secret

# ==========================================
# 5. WAN and Cloud Security: EdgeConnect & Axis Atmos (Optional)
# ==========================================
AXIS_ATMOS_KEY=your_axis_ro_api_key
EDGE_CONNECT_URL=https://orchestrator.yourdomain.com
EDGE_CONNECT_API_KEY=your_ec_ro_key

# ==========================================
# 6. Unused Solution (Automatically disabled if value is left blank)
# ==========================================
AOS8_CONDUCTOR_IP=
Step 3. Build container and run in background
docker compose up -d5. Practical Tips for Enterprise Operations (Security Principles and Client Selection)
These are practical points that must be taken into account when considering actual implementation in a corporate environment.
① Why must API permissions be 'Read-Only'?
This open-source project also includes some configuration change (Write) functionality, but in enterprise practice Connecting API keys for all platforms by issuing them with 'Read-Only' permissions only.We recommend this.
- Prevention of major disruptions caused by AI hallucinations: LLM must prevent critical incidents where it modifies VLANs of the wrong site or tamperes with data center configurations due to context misunderstanding or hallucinations.
- Change Audit (Audit Trail) and Governance Compliance: In enterprise infrastructure, even when changing a single setting, the history of the ITSM work ticket number, operator, and approver must be clearly recorded. If AI directly controls the system using API tokens from a public MCP server, the audit trail regarding “who made the change and on what grounds” becomes opaque, violating security auditing standards.
Therefore, the safest operational method is a separation of roles where “data collection and correlation analysis are entrusted to AI (MCP), while actual system control and change actions are performed by engineers using a verified dedicated console.”.
② Use 'VS Code + GitHub Copilot' instead of a separate out-of-pocket subscription
If you find it burdensome to subscribe to Claude Desktop Pro ($20/month) at your own expense, Enterprises can utilize the GitHub Copilot environment provided by default with M365.You can do it.
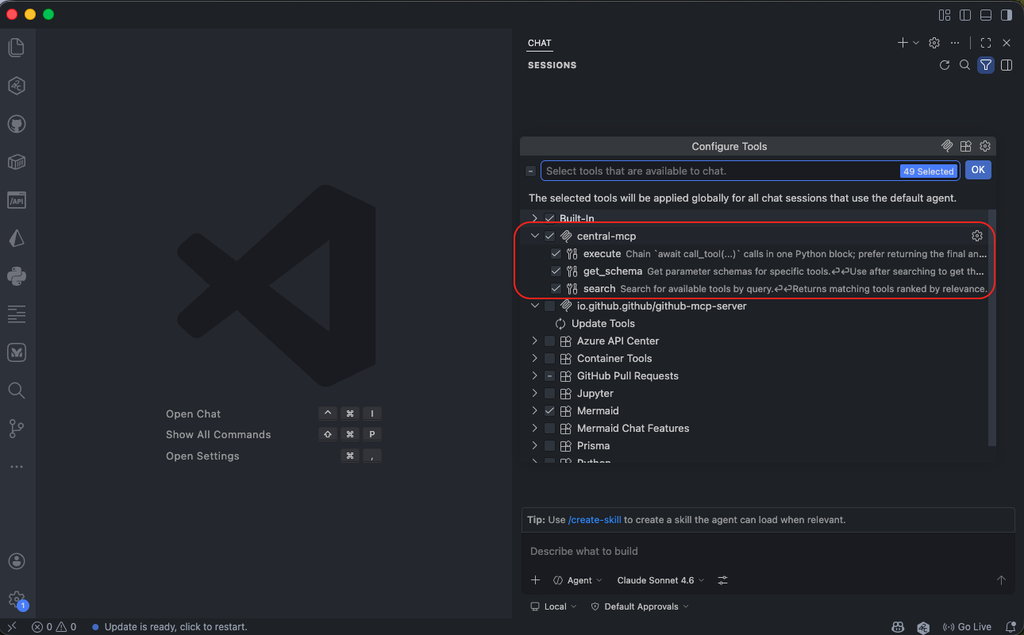
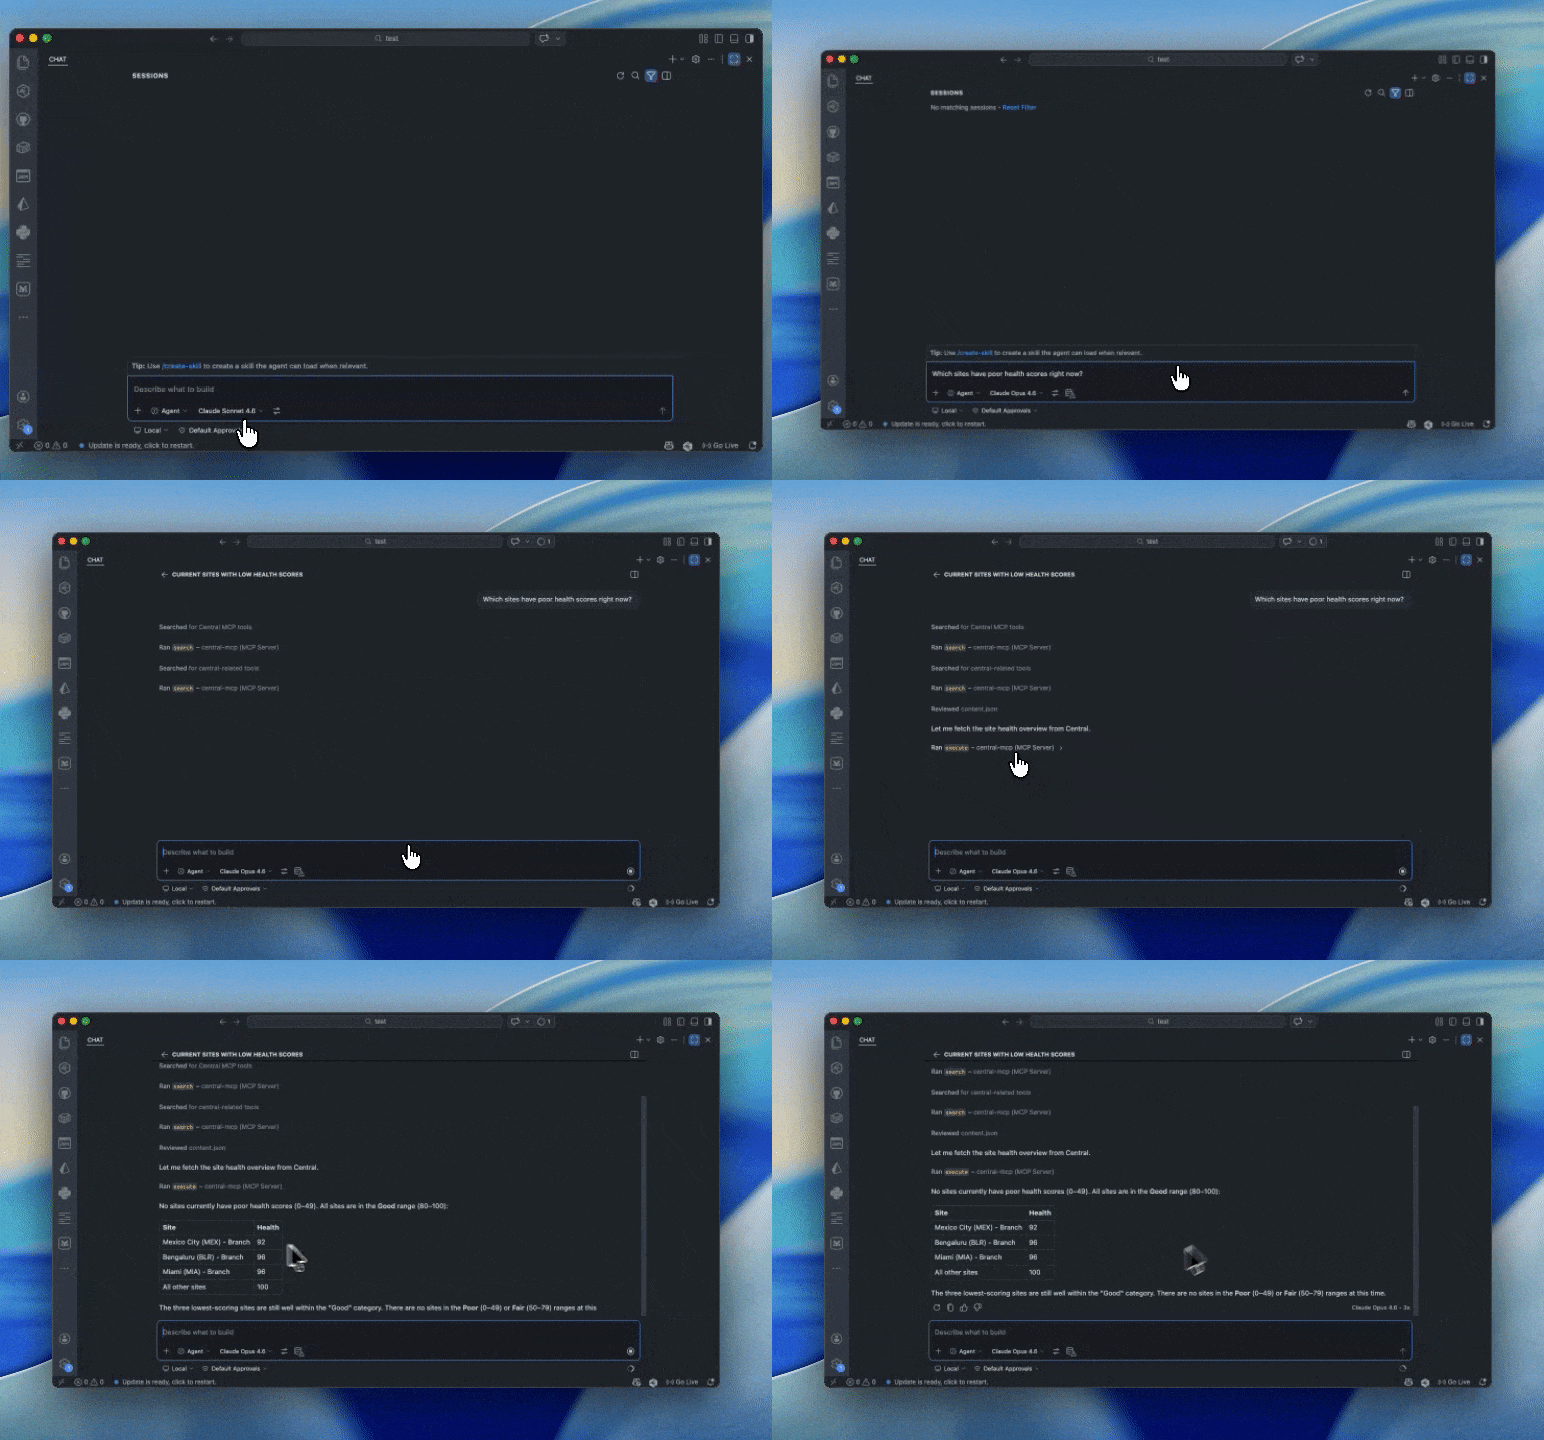
VS Code's GitHub Copilot Chat officially supports MCP integration. VS Code's MCP configuration file (mcp.jsonBy simply registering as shown below, you can operate the network monitoring agent using your company license without additional costs.
{
  ""mcpServers"": {
    "hpe-networking": {
      ""command"": ""docker"",
      ""args"": [
        ""exec"",
        ""-i"",
        ""hpe-networking-mcp"",
        ""python"",
        ""-m"",
        ""hpe_networking_mcp""
      ]
    }
  }
}
※ Of course, if you prefer the Claude Desktop app
claude_desktop_config.jsonYou may register and use the same content.
6. Practical Use Cases
Here are four representative scenarios where engineers can reduce troubleshooting and security analysis time with only view-only permissions.
① Remote Experienced Quality Diagnosis: Combined Analysis of Mist SLE × HPE UXI
When a complaint is received from a remote branch office stating that the “network is slow,” the first thing to check is, “Is it an infrastructure (equipment) issue, or is it a problem with the user terminal or external application?”.
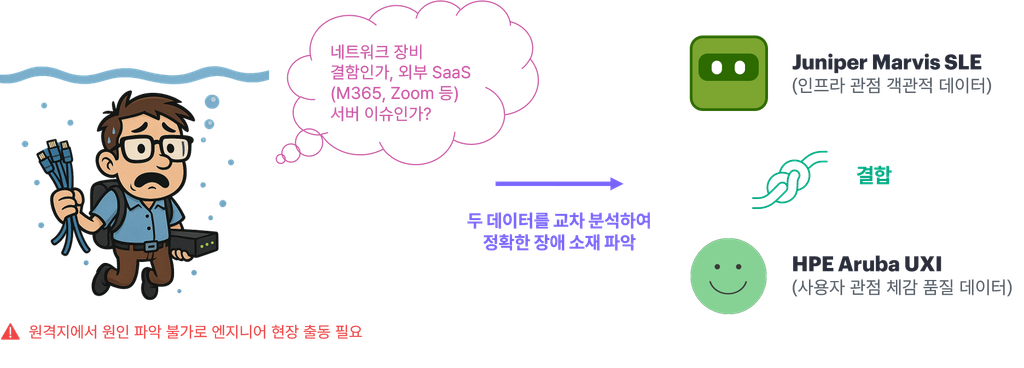
- Infrastructure Perspective (Juniper Mist SLE): Check client Time to Connect, Roaming Quality, and AP Capacity metrics from the perspective of the AP and wireless network.
- User Experience Perspective (HPE UXI): Sensors installed on-site operate like actual clients and measure end-to-end response times for everything from Wi-Fi coupling and DHCP to DNS queries and web applications such as in-house ERP or M365.
Example of query: “We received a complaint from the Busan branch regarding slow access to the internal ERP system. Please analyze the cause by combining Mist wireless SLE metrics and UXI sensor test results to determine whether it is an infrastructure equipment issue or a user terminal/app service issue.”
AI Analysis Report Example:
“Busan Branch's Wireless infrastructure (Mist) SLE metrics are normal (Coverage 98%, Throughput good)... On the other hand, checking the HPE UXI sensor metrics revealed that Wi-Fi and local L2/L3 latency is excellent at 12ms, but External DNS response delay to the in-house ERP server (3,200ms) and TCP round-trip delay in the specific cloud SaaS gateway segmentConfirmed as this bottleneckIt is now complete. It is determined to be an external DNS/routing issue, not a defect in the on-site AP equipment.”
② Lightweight Security Log Correlation Analysis: ClearPass × EdgeConnect × Axis Atmos (SIEM Lite)
Even without traditional SIEM (such as Splunk), combining these three solutions into an MCP allows you to utilize it as an on-demand security analyzer (SIEM Lite) that cross-references logs in real-time along the key pathways leading from “NAC ➔ SD-WAN ➔ Cloud/Internet Edge (SSE).”.
| Solution | Security monitoring area | Major Inquiry Telemetry (Read-Only) |
| ClearPass (CPPM) | Internal Authorization & Terminal Identity | View 802.1X authentication logs, endpoint profiling information, connection accounts, and assigned roles. |
| EdgeConnect | Branch/Edge Transmission (SD-WAN) | Abnormal session surge (signs of scanning), data center-directed traffic statistics, firewall drop logs |
| Axis Atmos | Cloud & External Access Control (SSE) | Malicious URL/phishing blocking logs, external C2 domain query blocking history, policy violation events |
Example of query: “Cross-analyze Axis Atmos threat blocking events, EdgeConnect abnormal outbound traffic logs, and ClearPass endpoint authentication history over the past 24 hours to identify suspicious endpoints with high security risks and their behavior timelines.”
AI Analysis Report Example:
[Security Threat Correlation Analysis Report: Suspicion of Internal Infection and Lateral Movement]
- Identification terminal:
10.20.5.45(MAC:XX:XX:XX:XX:XX:XX, Login Account:user-dev, terminal type:Windows Workstation)- Log Correlation Timeline:
14:02 (Axis Atmos): External malicious C2 domain from the IP (malicious-c2.com5 web access attempts to ) were blocked. 14:05 (EdgeConnect): Immediately after external communication is blocked, on the terminal, the headquarters data center subnet (192.168.10.0/24Abnormal L4 port scan (TCP 445, 3389) sessions in the ) direction surged to over 1,200 and were dropped by the firewall policy. 14:08 (ClearPass): As a result of looking up the MAC address, it passed 802.1X authentication at 09:12 AM and is currently at the switch port on the 3rd floor of Annex 3 (Gi1/0/14)atEmployee-DataConfirmed that the connection is being maintained with permission.
- Analysis Conclusions and Recommendations: This is a typical breach pattern where an infected terminal with blocked external C2 communication attempts to spread within the internal network. Security personnel should quarantine the session in the ClearPass console and the physical port (
Gi1/0/14Please perform a thorough inspection of the PC connected to ).
③ Full Stack One-Shot Check from Campus Edge to Data Center Fabric (site_health_check + Apstra)
In the event of daily morning maintenance or company-wide service delays, there is no need to open the campus wired/wireless console and the data center fabric console separately. Briefing end-to-end infrastructure health at a glance with a single promptReceive.
Example of query: “"Check the overall infrastructure health status of the Pangyo headquarters campus (Mist, Central, ClearPass) and the Pangyo data center fabric (Apstra) in a single shot, and summarize if there are any interconnected anomalies."”
Internal Operation (Code Mode Parallel Collection):
- Campus area (
site_health_check): Integrated viewing of Mist (Wireless SLE/Alarms), Central (Campus Core/Distribution Switch Status), and ClearPass (Authentication Failure Counts by NAD)- Data center area (
Apstra): Check real-time anomalies in the Data Center Blueprint, BGP/EVPN session status between the leaf and spine, and the presence of uncommitted diffs awaiting deployment.
AI Analysis Report Example: [Pangyo Headquarters Campus ~ Data Center Integrated Health Report]
- Campus Wireless/Authentication (Mist & ClearPass): Normal (AP Uptime 100%, 802.1X Authentication Success Rate 99.4%)
- Campus Wired Core (Aruba Central): 1 Warning — Campus Core Switch (
PAN-CORE-SW01Detecting intermittent path reconvergence on uplink ports in the ) and data center border leaf segments- Data Center Fabric (Juniper Apstra): Attention (Anomaly Detection) —
Pangyo-DC-ProdBorder Reef in Blueprint (Border-Leaf-02One BGP session connected to the external routing zone in ) is in a flap state, and the EVPN Type-5 route recalculation alarm is enabled accordingly.- Conclusion of Comprehensive Correlation Analysis: Wireless and authentication at the campus user level are perfectly normal, but the root cause of the path jitter detected by the campus core switch is Data center Apstra fabric
Border-Leaf-02External BGP peering instabilityIt is attributed to the DC Operations TeamBorder-Leaf-02You must first check the physical optical cable signal (DOM) and BGP peer status.
Similarly, issues in the boundary zone, which could potentially become a back-and-forth game between the campus team and the data center team, are resolved by comparing the telemetry of both domains at once to pinpoint the exact location of the failure in just one minute.
④ Vendor-independent wireless environment dashboard (site_rf_check)
Even at sites where Mist AP and Aruba AP coexist in a transitional period, channel interference and resource usage can be identified in a unified manner.
Example of query: “Please analyze the 5GHz and 6GHz RF interference conditions around the conference room on the 5th floor of headquarters.”
- movement: Collect channels, bandwidth, TX power, channel occupancy, and noise floor from Mist and Central.
- result: Provides an integrated ASCII RF matrix diagram that can be understood immediately within the chat window
This is a representative scenario that reduces the workload of engineers when querying the AI chat window in natural language after integration.
In conclusion
Integrating LLM into network infrastructure does not mean handing over absolute control to AI.
rather Reducing the time engineers spent switching between console tabs on 'simple data aggregation' and 'log comparison between heterogeneous domains' to near zero, within the safe guardrails of a read-only environment.This is the key.
Attach a single MCP container to the GitHub Copilot (or Claude) you already own on your internal enterprise account. The most secure and powerful AIOps will be achieved when you leave the collection and primary correlation analysis from the campus edge to the data center fabric and security logs to AI, allowing engineers to focus on “what architectural and operational decisions to make based on the analyzed evidence.”.