최근 IT인프라의 복잡성이 높아지면서 점점 더 많은 장치들이 네트워크에 연결되고 있습니다.
네트워크 운영자들은 어떠한 장비가 어디에 연결되어 어떤 행위를 하는지가 가장 큰 숙제입니다.
그 때문에 가시성과 시각화 등을 제공하기 위한 옵저버빌리티 솔루션들이 많이 소개되고 있습니다.
오늘은 별도의 솔루션을 도입하고 구축하지 않더라도 네트워크 트래픽에 대한 가시성을 확보하고 유선 환경에서 발생하는 트래픽에서 애플리케이션 정보를 파악할 수 있는 기능을 소개하고자 합니다.
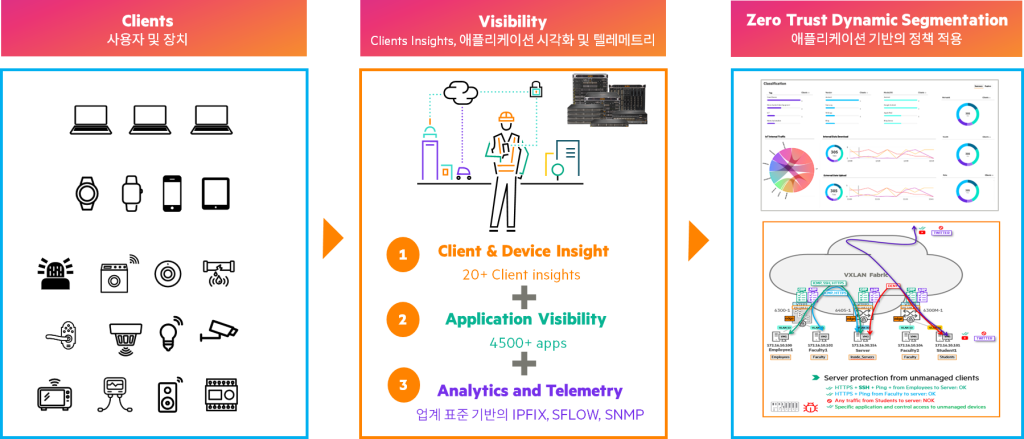
HPE Aruba Networking AOS-CX 스위치에서는 애플리케이션에 대한 정보를 파악하고 보안 정책을 정의할 수 기능을 제공합니다.
- Client Insight: HPE Aruba Networking Central(CNX)의 Foundation License에서 기본 제공
- Application Recognization(AR): HPE Aruba Networking Central(CNX)의 Foundation License에서 기본 제공
- Application Recognization & Control(ARC): CX Advanced License 또는 Central(CNX)의 Advanced License
- Traffic Insight(TI): 별도 라이선스 필요 없음
- IPFIX: 별도 라이선스 필요 없음
- Edge Insight: ARC 기능 중 하나
Client Insight
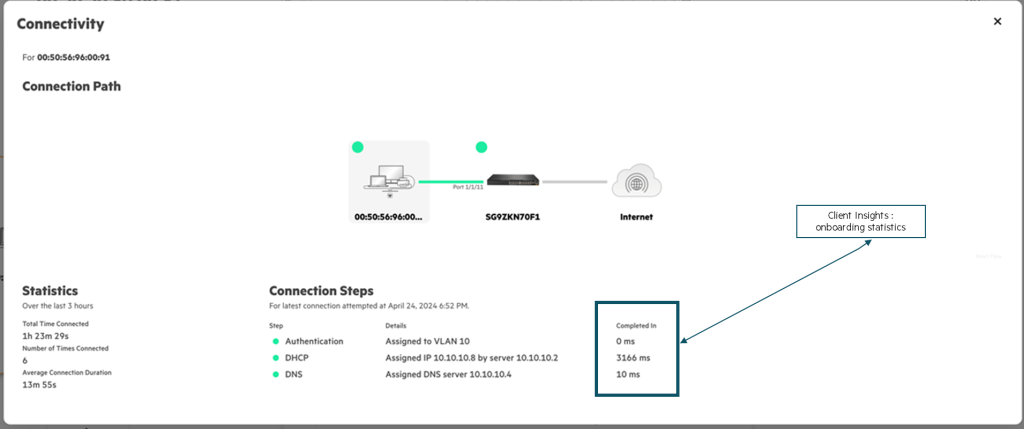
Client Insight 기능은 클라이언트의 L2, L3 및 L4 단계 온보딩 세부 정보를 캡처하는 것을 목표로 합니다.
Client Insight 기능을 통해 표시된 세부 정보는 Central에서 더 나은 인사이트를 제공하기 위해 사용됩니다.
- L2: 클라이언트가 인증/권한을 받습니다.
포트에서 보안이 비활성화되어 있으면 클라이언트는 L2 온보딩된 클라이언트로 취급됩니다. - L3: 클라이언트가 DHCP 프로세스를 통해 IP 주소를 획득합니다.
- L4: 클라이언트가 DNS 이름 확인을 위해 DNS 서비스에 액세스 중입니다.
IPFIX 및 TI 모니터 앱 유형 dns-onboarding-latency 및 dns-average-flows가 활성화되어 있어야 합니다.
DNS on-boarding, DNS average-latency 기능은 CX 6200에서 지원되지 않습니다.
switch# diag-dump client-insight basic
=========================================================================
[Start] Feature client-insight Time : Wed May  5 15:45:34 2022
=========================================================================
-------------------------------------------------------------------------
[Start] Daemon client-insightd
-------------------------------------------------------------------------
Feature client-insight:

  Global client-insight         = ENABLED
  Client on-boarding event logs = ENABLED

Displaying client entries with (mac) as key.
Total number of entries: 3

MAC : 00:11:01:00:00:08
-----------------------
  Overall on-boarding status         : -
  Overall on-boarding failure reason : -

  L2 on-boarding detail
  ---------------------
    L2 on-boarding status         : successful
    L2 on-boarding failure reason : -
    L2 authentication start time  : 05/18/22 15:01:01.456789 UTC
    L2 authentication end time    : 05/18/22 15:01:02.123456 UTC
    L2 authentication latency     : 0 min, 0 sec, 666667 us
    802.1x RADIUS latency         : -
    MAC-Auth RADIUS latency       : 0 min, 0 sec, 332456 us

  L3 on-boarding detail
  ----------------------
    L3 on-boarding status           : in_progress
    L3 on-boarding failure reason   : -
    L3 on-boarding latency          : -

    VLAN : 10
    -----------
      IP details
      ----------
        IPv4 on-boarding status         : successful
        IPv6 on-boarding status         : -

        DHCPv4                                           DHCPv6
        ------                                           ------
          Status         : successful                      Status         : -
          Failure reason : -                               Failure reason : -
          Start time     : 05/18/22 15:01:02.456789 UTC    Start time     : -
          End time       : 05/18/22 15:01:02.999988 UTC    End time       : -

    VLAN : 20
    -----------
      IP details
      ----------
        IPv4 on-boarding status         : In_Progress
        IPv6 on-boarding status         : -

        DHCPv4                                           DHCPv6
        ------                                           ------
          Status         : In_Progress                     Status         : -
          Failure reason : -                               Failure reason : -
          Start time     : 05/18/22 15:01:03.256485 UTC    Start time     : -
          End time       : -                               End time       : -

  DNS details
  -----------
    Server IP: 172.16.1.8
    ---------------------
      Average latency                        : 0 min, 0 sec, 432456 us
      DNS start time for latency calculation : 05/18/22 15:01:03.123456 UTC
      DNS end time for latency calculation   : 05/18/22 15:01:03.425466 UTC
      Number of DNS requests                 : 16

   Server IP: 2003::1
   ---------------------
      Average latency                        : 0 min, 0 sec, 432456 us
      DNS start time for latency calculation : 05/18/22 15:01:03.123456 UTC
      DNS end time for latency calculation   : 05/18/22 15:01:03.425466 UTC
      Number of DNS requests                 : 16


MAC : 00:11:01:00:00:09
-----------------------
  Overall on-boarding status         : failed
  Overall on-boarding failure reason : l2_onboarding_failed

  Authentication details
  ----------------------
    L2 on-boarding status         : auth_failed
    L2 on-boarding failure reason : server-reject
    L2 authentication start time  : 05/18/22 15:01:01.456789 UTC
    L2 authentication end time    : -
    L2 authentication latency     : -
    802.1x RADIUS latency         : -
    MAC-Auth RADIUS latency       : -

  L3 on-boarding detail
  ----------------------
    L3 on-boarding status           : in_progress
    L3 on-boarding failure reason   : -
    L3 on-boarding latency          : -

  VLAN : 2
  -----------
    IP details
    ----------
      IPv4 on-boarding status         : in_progress
      IPv6 on-boarding status         : -

      DHCPv4                                           DHCPv6
      ------                                           ------
        Status         : in_progress                     Status         : -
        Failure reason : -                               Failure reason : -
        Start time     : 05/18/22 15:01:02.436485 UTC    Start time     : -
        End time       : -                               End time       : -

  DNS details
  -----------
    No Servers


MAC : 00:11:01:00:00:1a
-----------------------
  Overall on-boarding status         : successful
  Overall on-boarding failure reason : -

  Authentication details
  ----------------------
    L2 on-boarding status         : successful
    L2 on-boarding failure reason : -
    L2 authentication start time  : 05/18/22 15:01:01.456789 UTC
    L2 authentication end time    : 05/18/22 15:01:02.153785 UTC
    L2 authentication latency     : 0 min, 0 sec, 696996 us
    802.1x RADIUS latency         : -
    MAC-Auth RADIUS latency       : 0 min, 0 sec, 193946 us

  L3 on-boarding detail
  ----------------------
    L3 on-boarding status           : successful
    L3 on-boarding failure reason   : -
    L3 on-boarding latency          : 0 min, 0 sec, 565638 us

  VLAN : 2
  -----------
    IP details
    ----------
      IPv4 on-boarding status         : successful
      IPv6 on-boarding status         : -

      DHCPv4                                           DHCPv6
      ------                                           ------
        Status         : successful                      Status         : -
        Failure reason : -                               Failure reason : -
        Start time     : 05/18/22 15:01:02.436485 UTC    Start time     : -
        End time       : 05/18/22 15:01:03.002123 UTC    End time       : -

  DNS details
  -----------
    Server IP: 172.16.1.8
    ---------------------
      Average latency                        : 0 min, 0 sec, 293946 us
      DNS start time for latency calculation : 05/18/22 15:01:03.436485 UTC
      DNS end time for latency calculation   : 05/18/22 15:06:03.436485 UTC
      Number of DNS requests                 : 16

-------------------------------------------------------------------------
[End] Daemon client-insightd
-------------------------------------------------------------------------
=========================================================================
[End] Feature client-insight
=========================================================================
Diagnostic-dump captured for feature client-insight
차세대 Central, CNX에서 Client 정보를 확인하면, 아래 화면과 같은 Insight를 확인할 수 있습니다.
CX 스위치에서 Client Insight를 활성화하는 Command는 다음과 같습니다.
switch(config)# client-insight enable각 클라이언트의 온보딩 상태를 나열하는 이벤트 로그를 생성할 수 있습니다.
온보딩 이벤트 로그는 기본적으로 비활성화되어 있습니다.
Onboarding(온보딩) 이벤트 로그가 작동하려면 클라이언트 온보딩 전에 Client Insight 기능을 활성화해야 합니다.
switch(config)# client-insight event-log client-onboardingApplication Recognition (AR)
AOS-CX 스위치에는 DPI(Deep Packet Inspection)이라는 L7 기반의 패킷 검사 엔진이 탑재되어 있습니다.
스위치를 통과하는 트래픽에서의 애플리케이션을 인지하기 위해서는 AR 또는 ARC 기능이 필요합니다.
QOSMOS DPI 엔진을 활용하여 아래와 같은 정보 등을 식별합니다.
- L7 컨텐츠에 대한 플루우별 정보: src-ip, dst-ip, src-port, dst-port 등
- 애플리케이션 정보: 애플리케이션 id, 애플리케이션 이름, 카테고리 등
- TLS 정보: 인증서 암호(Cipher), TLS 버전, 서버 이름 등
애플리케이션 인지 기능은 유선 스위치 포트에서만 동작하며, IPv4/IPv6의 TCP/UDP 기반의 Unicast 트래픽만 대상입니다.
AOS-CX 10.15 기준, 22개의 카테고리에서 4,500개의 애플리케이션을 식별할 수 있습니다.
LAG(Link Aggregation Group), MCLAG(Multi-Chassis LAG), ROP(Route Only Port) 및 SVI(스위치 가상 인터페이스)에서는 ARC가 지원되지 않습니다.
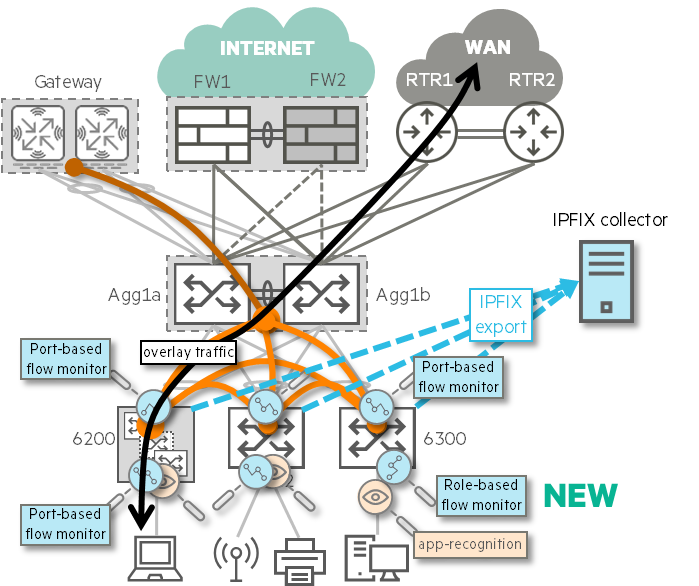
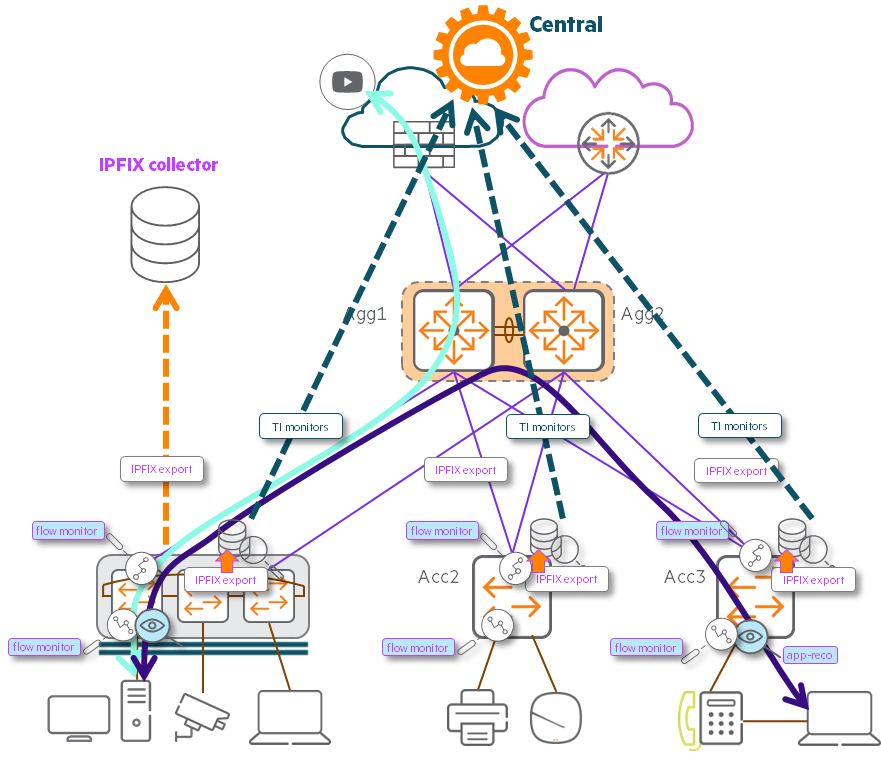
그럼 이 기능이 왜 필요한지, 기존 방식과는 어떻게 다른지 볼까요?
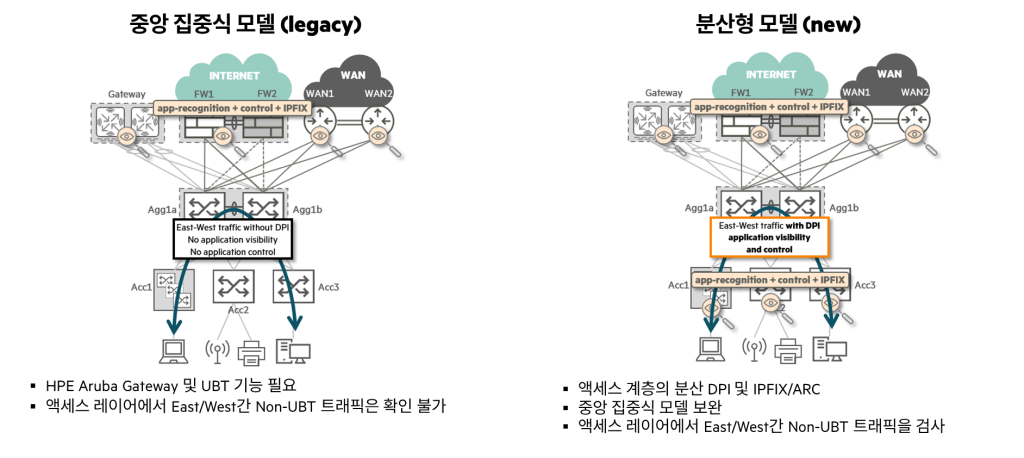
위 그림과 같이 기존의 애플리케이션 인지하는 방식은 스위치와 게이트웨이(컨트롤러)간의 UBT 터널링을 구성했을 때, 게이트웨이(컨트롤러)의 DPI 엔진을 활용해서 애플리케이션을 식별할 수 있었습니다. 즉, UBT 환경의 트래픽이 아닌 액세스 계층 내의 트래픽을 식별할 수가 없었습니다.
하지만, 액세스 스위치 자체에서 애플리케이션을 인지할 수가 있게 되면, UBT 터널링 구성이 없더라도 식별이 가능해집니다.
CX 스위치 모두가 이 기능을 지원하는 것은 아닙니다.
지원하는 스위치 모델이 제한되어 있으며, 각 모델별로 허용 가능한 트래픽 플로우가 다릅니다.
자세한 내용은 AOS-CX 스위치 가이드 문서를 참고해주세요.
여기서 더 나아가서 CX 10.14 버전부터 Fast Mode가 업데이트 되었습니다.
switch(config)# app-recognition
switch(config-app-recognition)# mode
  default  Process additional packets to get URL and TLS attribute.
  fast     Relies on first packet classification to get only APP name and category.
Fast Mode는 두 가지 동작 방식이 혼합되어 있습니다.
- 이미 식별된(Known) 애플리케이션이면 CPU로 패킷을 전송하지 않습니다.
- 경우에 따라 FPC(First Packet Classification)을 활용합니다.
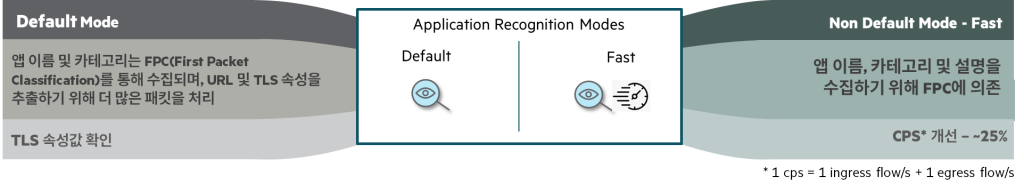
빠르게 식별하기 위해서 TLS 속성값 등은 확인하지 않고 오직 application-id와 이름, 카테고리 정도만 확인합니다.
기본(Default) 모드에서는 식별을 위해 7개 정도의 패킷이 필요하지만, Fast 모드에서는 4개 미만의 패킷으로 충분합니다.
즉, SYN/ACK을 제외하면 2개 미만의 패킷으로 식별하기 때문에 25% 이상의 성능 향상을 가져옵니다.
대신, TLS 정보를 확인하지 않기 때문에 App URL을 확인할 수는 없습니다.

App Recognition을 활성화하기 위해서는 우선 해시 테이블의 공간을 비워줍니다.
이 단계는 Flow Tracking 기능을 활성화하는 데 필요하며, ARC가 제대로 작동하려면 이 기능이 작동해야 합니다.
switch(config)# no ip source-lockdown resource-extended
switch(config)# flow-tracking
switch(config-flow-tracking)# enable
이제 App Recognition 기능을 활성화합니다.
스위치 전체에 기능을 활성화 할 때는 아래와 같이 명령어를 입력합니다.
switch(config)# app-recognition
switch(config-app-recognition)# enable
특정 인터페이스 또는 특정 역할(Role)에 대해서만 활성화 하려면 다음과 같이 구성합니다.
switch(config)# int 1/1/1
switch(config-if)# app-recognition enable
switch(config)# port-access role employee
switch(config-pa-role)# app-recognition enableApp Recognition 기능은 액세스 포트 외에 업링크, LAG 인터페이스에서는 사용하지 않아야 합니다.
ISSU(In-Service Softwate Upgrade) 중에는 AR 기능이 중단됩니다.
IPFIX
IPFIX(IP Flow Information Export)는 네트워크 장치에서 트래픽 흐름(Flow)의 정보를 내보내기 위한 IETF 표준입니다.
낮은 리소스로 샘플링 없이 정보를 수집하기 때문에 수요 예측이나 빌링, 보안 분석 등의 작업을 위해 사용됩니다.
IPFIX 모니터링 솔루션은 다음과 같이 구성됩니다.
- IPFIX Exporter: 스위치나 라우터 등 네트워크 장비에서 실행하여 정보 생성하여 내보내기
- IPFIX Collector: IPFIX Exporter로부터 모니터링 정보를 수신
IPFIX는 Match Field와 Collect Field 두 개의 Flow Record로 정의할 수 있습니다.
- Match Field: IPv4 또는 IPv6에서의 Tuple 데이터(출발지/목적지 IP, 출발지/목적지 포트, 프로토콜)
- Collect Field: 수집되는 플로우 정보를 지정하는 Non-Key 필드
(Flow 볼륨(byte or packet), Flow 시작/종료 시간, 애플리케이션 이름, DNS 응답 코드, egress 인터페이스/큐/VLAN, 포워딩 상태, http-요청-대상, TLS 속성 등)
CX 스위치는 ingress direction 및 IPv4/IPv6, unicast/multicast 트래픽, ICMP 등을 모델에 따라 지원합니다.
IPFIX와 sFlow는 트래픽 흐름(Flow) 정보를 얻어낸다는 점에서는 같아 보일 수 있지만 아래와 같은 차이가 있습니다.
| sFlow | IPFIX |
|---|---|
| Flow 샘플링 기술(n 패킷 중 1개) | 샘플링 없음 (해당 플로우의 모든 패킷이 카운트됨) |
| Flow 지속시간을 보고하지 않음 | Flow 지속시간 제공 |
| 샘플에 데이터그램 포함(최대 9,000byte 페이로드) | Flow에 독점정보(AppID) 지정 및 Collector로 내보내기 가능 |
| URL 추적 없음 | URL과 같은 정보 내보내기 위한 가변길이 필드 허용 |
| ASIC 테이블 리소스 사용 없음 | ASIC 리소스 사용 |
| CPU 집약점 (CoPP로 보호) | CPU 집약적이지 않음 |
Data Center IPFIX (CX 10.14+)
CX 8325 스위치를 포함하여 CX 6200/6300/6400, CX 8360의 경우에는 포트 기반의 방식으로 IPFIX를 구성합니다.
TCAM(Ternary Content-Addressable Memory) 대신에 Flow 데이터를 EM(Exact Match) 테이블에 저장합니다.
TCAM은 보안 프로토콜을 비롯한 여러 프로토콜에서 공유되는 수요가 많은 리소스입니다.
따라서 IPFIX flow가 감지는되지만, EM 테이블이라는 다른 테이블에 저장됩니다.이 EM 테이블은 L2, L3, 멀티캐스트와 같은 다른 기능에서 해당 기능의 규모를 달성하기 위해 사용됩니다.
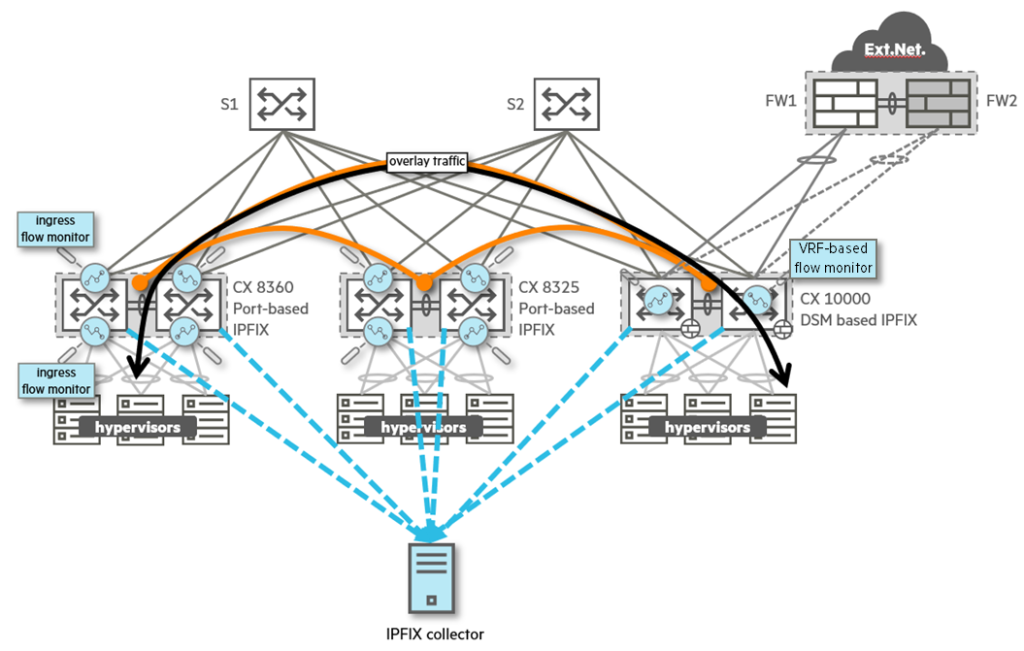
TopN과 Flow 정보에 대한 Traffic Insight를 지원하며, 최대 32,000개의 IP Flow 데이터를 지원합니다.
Campus IPFIX (CX 6200/6300/6400 10.14+)
CX 6200/6300/6400과 같은 캠퍼스 포트폴리오의 제품군은 포트 기반이 아닌 역할 기반으로 동작합니다.
TCAM 대신 IP Flow Table을 사용하여IP 버전과 관계 없이 더 나은 확장성을 보여줍니다.
CX 8325에서 적용되는 포트기반의 방식이 역할기반보다 더 우선시 됩니다.
그리고 LUR(Local-user-role)과 DUR(Downloadable-user-role), 단말 프로필을 지원합니다.
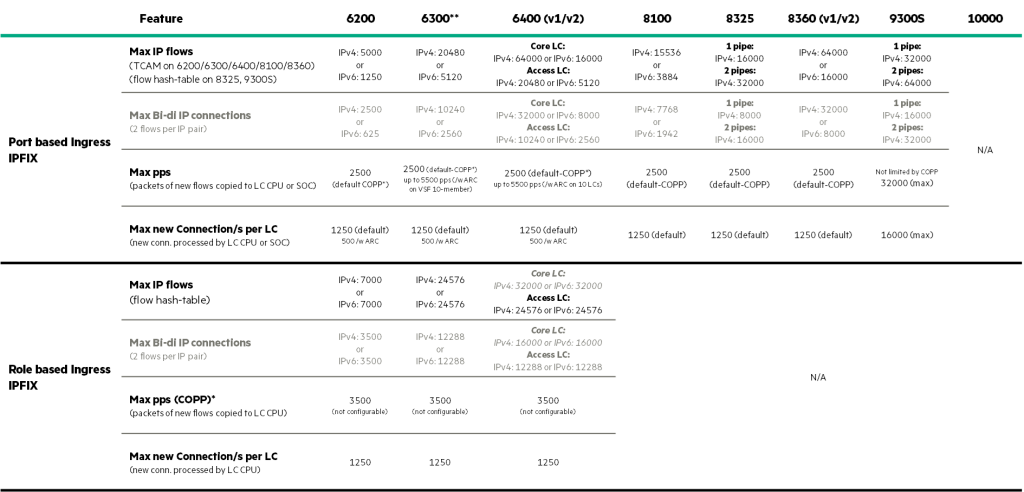
각 CX 스위치 모델별 IPFIX의 규모(Scale)은 아래 표와 같습니다.
CX 스위치에서 IPFIX를 구성하기 위해서는 아래와 같이 Command로 구성할 수 있습니다.
우선 수집(collect)을 위한 Flow Record를 생성합니다.
switch(config)# flow record flowRecordv4
switch(config-flow-record)# match ip protocol
switch(config-flow-record)# match ip source address
switch(config-flow-record)# match ip destination address
switch(config-flow-record)# match ip version
switch(config-flow-record)# match transport destination port
switch(config-flow-record)# match transport source port
switch(config-flow-record)# collect counter bytes
switch(config-flow-record)# collect counter packets
switch(config-flow-record)# collect application name
switch(config-flow-record)# collect timestamp absolute first
switch(config-flow-record)# collect timestamp absolute last
switch(config-flow-record)# collect application https url
그리고 Flow exporter(Target)을 생성합니다.
switch(config)# flow exporter myTarget
switch(config-flow-exporter)# dest type hostname-or-ip-addr
switch(config-flow-exporter)# destination 1.2.3.4
-----
switch(config)# flow exporter localTI ## For Traffic Insights
switch(config-flow-exporter)# export-protocol ipfix
switch(config-flow-exporter)# destination type traffic-insight
switch(config-flow-exporter)# destination traffic-insight TI
Flow Monitor를 생성합니다.
switch(config)# flow monitor myMonitorv4
switch(config-flow-monitor)# record flowRecordv4
switch(config-flow-monitor)# exporter myTarget
switch(config-flow-monitor)# exporter localTI
마지막으로 인터페이스나 역할에 적용합니다.
switch(config)# int 1/1/1
switch(config-if)# app-recognition enable ## Optional
switch(config-if)# ip flow monitor myMonitorv4 in
switch(config-if)# ipv6 flow monitor myMonitorv6 in
switch(config)# flow-tracking
switch(config-flow-tracking)# enable
switch(config-flow-tracking)# flow statistics enable
switch(config)# port-access role monitored
switch(config-pa-role)# app-recognition enable ## Optional
switch(config-pa-role)# ip flow monitor myMonitorv4
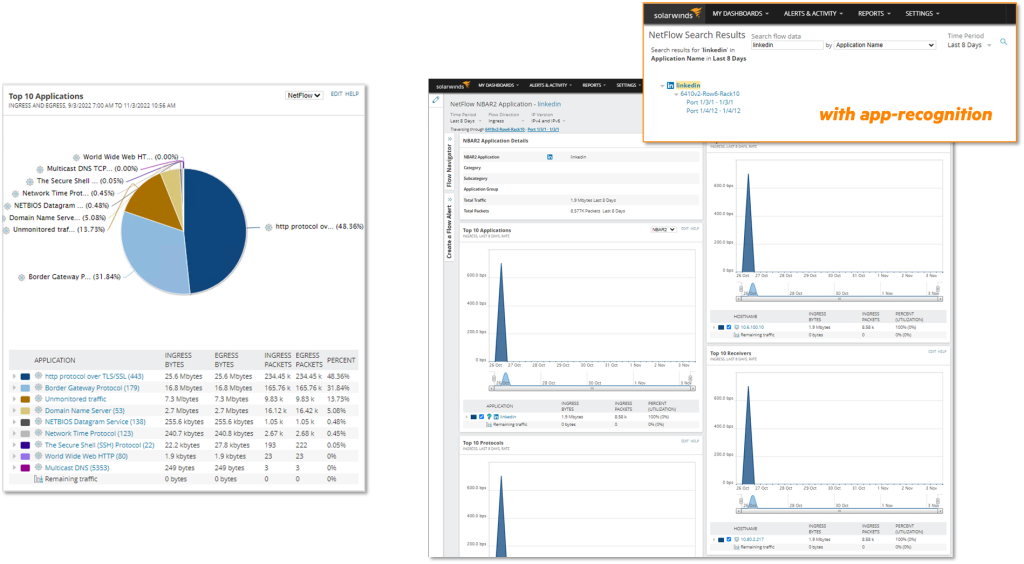
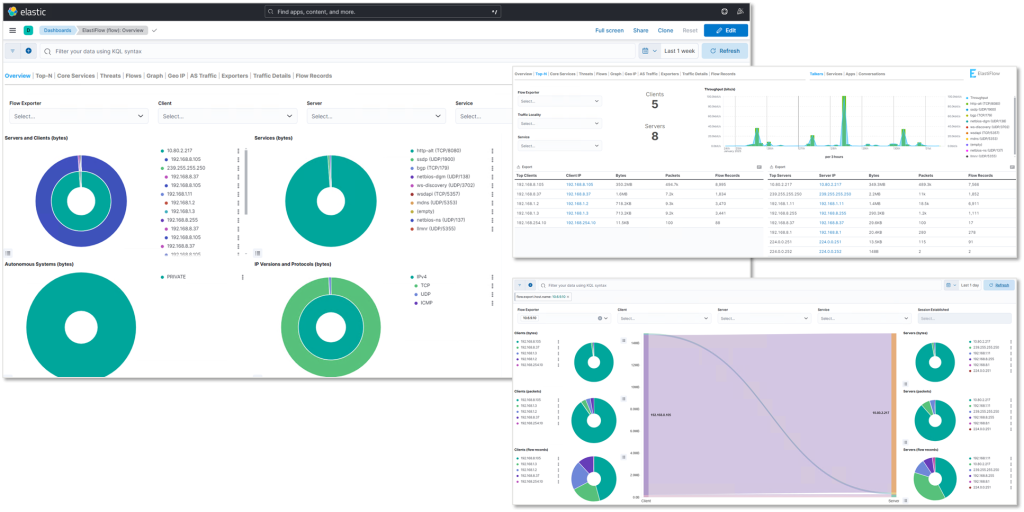
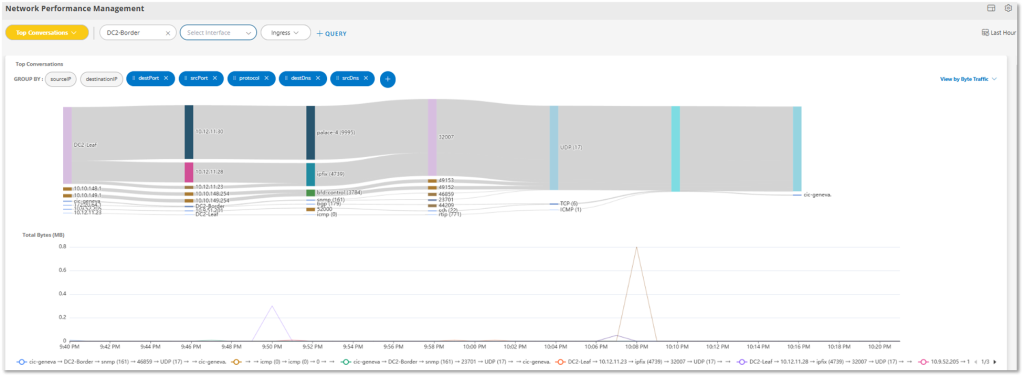
switch(config-pa-role)# ip flow monitor myMonitorv6IPFIX 데이터를 활용하면, 아래와 같이 다양한 시각화 솔루션과 연동할 수 있습니다.
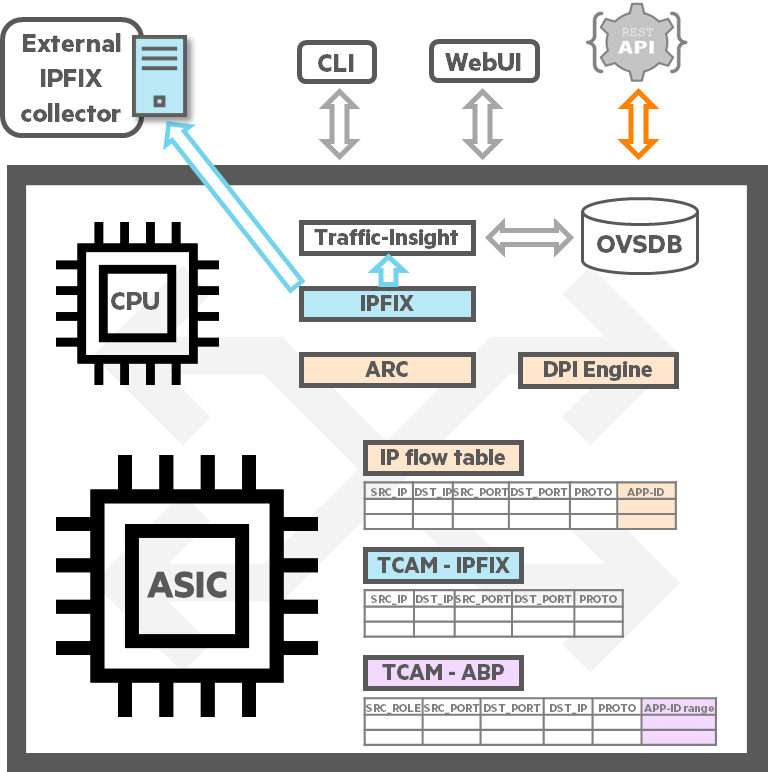
Traffic Insight
Traffic Insight(TI)는 CX 스위치 내부에서 IPFIX Collector 역할을 수행합니다.
외부 Exporter로부터 IPFIX를 받을 수는 없지만, 외부의 Collector와 동일한 데이터셋을 수신합니다.
트래픽 플로우 데이터를 OVSDB(Open vSwitch Database)로 집계합니다.
이 집계된 데이터는 API나 Central, CLI 등에서 분석 등의 목적으로 사용 가능하게 됩니다.
스위치의 Web UI의 TopN 플로우 보고서 및 시각화를 통해 빠르고 쉽게 모니터링 및 트러블 슈팅이 가능해집니다.

Traffic Insight는 아래와 같은 유형들로 모니터링이 가능합니다.
- TopN Flow (볼륨별 5~20개, 매 5분마다): IPv4/v6 트래픽을 모니터링 및 상위 N개의 볼륨 흐름(바이트 단위)을 캡처
– Top-N Flow 보고서는 5분마다 한 번씩 생성되며 이 타이머는 변경 불가
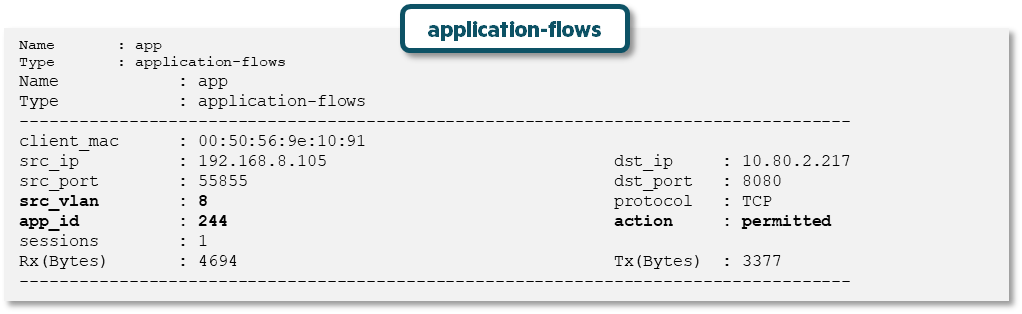
- Application Flow: Client-to-Server/Server-to-Client ingress 플로우 데이터를 모두 집계하여 단일 플로우로 병합
– Rx 및 Tx 바이트 세부 정보를 제공
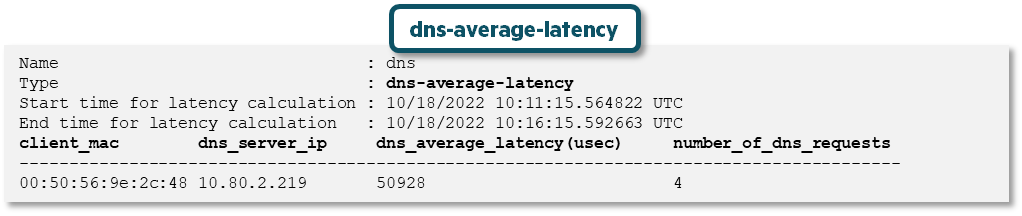
- dns-average-latency: DNS 요청 및 응답을 모니터링하고 클라이언트별 평균 DNS 지연 시간 세부 정보 제공
- Raw-Flows: 모든 앱 또는 클라이언트에 대한 단방향 흐름 세부 정보를 CNX에 온디맨드 방식으로 제공
- dns-onboarding-latency: DNS 요청 및 응답을 모니터링하고 클라이언트별 온보딩 DNS 지연 시간 세부 정보 제공
- workload-flows: Unicast 트래픽을 모니터링하고 해당 플로우에 대한 송수신 카운터 및 조치를 제공
- dropped-flows: 다양한 이유로 삭제된 트래픽 흐름을 모니터링
로컬 스위치의 소스만 exporter로 사용하여 시각화할 수 있습니다.
TopN의 트래픽은 최대 20개의 애플리케이션까지만 가능합니다.
ISSU 동안에는 손실이 발생하며, 최대 2000개의 Application flow까지 가능합니다.
Traffic-Insight 구성 방법
Traffic Insight를 구성하기 위해서는 Flow Exporter와 Flow Record 설정을 해줘야 합니다.
Flow Exporter 항목에서 destination을 traffic-insight로 정의합니다.
switch(config)# flow exporter TI
switch(config-flow-exporter)# description internal traffic-insight
switch(config-flow-exporter)# destination type traffic-insight
switch(config-flow-exporter)# destination traffic-insight TI1
Match 필드와 Collect 필드를 구성하여 Flow에 기록할 데이터를 정의합니다.
switch(config)# flow record REC4-1
switch(config-flow-record)# description collect all IPv4
switch(config-flow-record)# match ipv4 destination address
switch(config-flow-record)# match ipv4 protocol
switch(config-flow-record)# match ipv4 source address
switch(config-flow-record)# match ipv4 version
switch(config-flow-record)# match transport destination port
switch(config-flow-record)# match transport source port
switch(config-flow-record)# collect application name
switch(config-flow-record)# collect counter bytes
switch(config-flow-record)# collect counter packets
switch(config-flow-record)# collect timestamp absolute first
switch(config-flow-record)# collect timestamp absolute last
Flow Monitor는 인터페이스의 네트워크 트래픽에서 데이터를 flow record(REC4-1)에 정의된 형식으로 캐시에 저장합니다.
그러면 monitor와 연결된 Flow Exporter(TI)가 플로우 캐시에서 destination(TI1)으로 데이터를 내보냅니다.
switch(config)# flow monitor MON4-1
switch(config-flow-monitor)# description IPv4 monitor
switch(config-flow-monitor)# cache timeout active 1800
switch(config-flow-monitor)# cache timeout inactive 30
switch(config-flow-monitor)# exporter TI
switch(config-flow-monitor)# record REC4-1
트래픽 흐름을 모니터링할 인터페이스에 앞서 구성한 flow monitor를 입력합니다.
그리고 app-recognition도 활성화 해줍니다.
switch(config)# interface 1/1/1
switch(config-if)# no shutdown
switch(config-if)# no routing
switch(config-if)# vlan access 11
switch(config-if)# ip flow monitor MON4-1 in
switch(config-if)# app-recognition enable
switch(config-if)# exit
이제 Traffic insight를 동작시키기 위해 필요한 정책을 정의합니다.
Flow exporter를 통해 얻은 데이터를 토대로 모니터링을 실시하여 각 요청에 대한 모니터링 보고서를 제공합니다.
switch(config)# traffic-insight TI1
switch(config-ti)# enable
switch(config-ti)# source ipfix
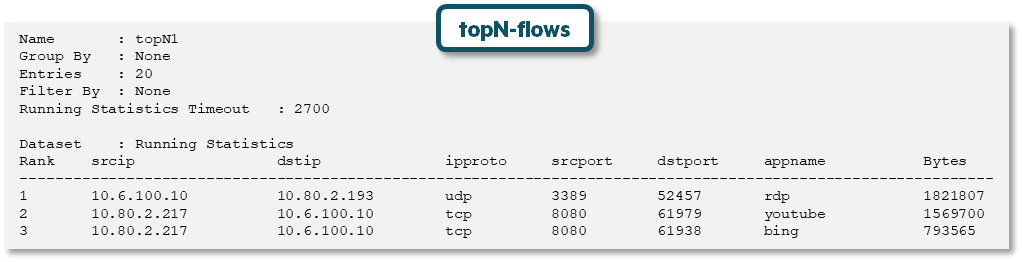
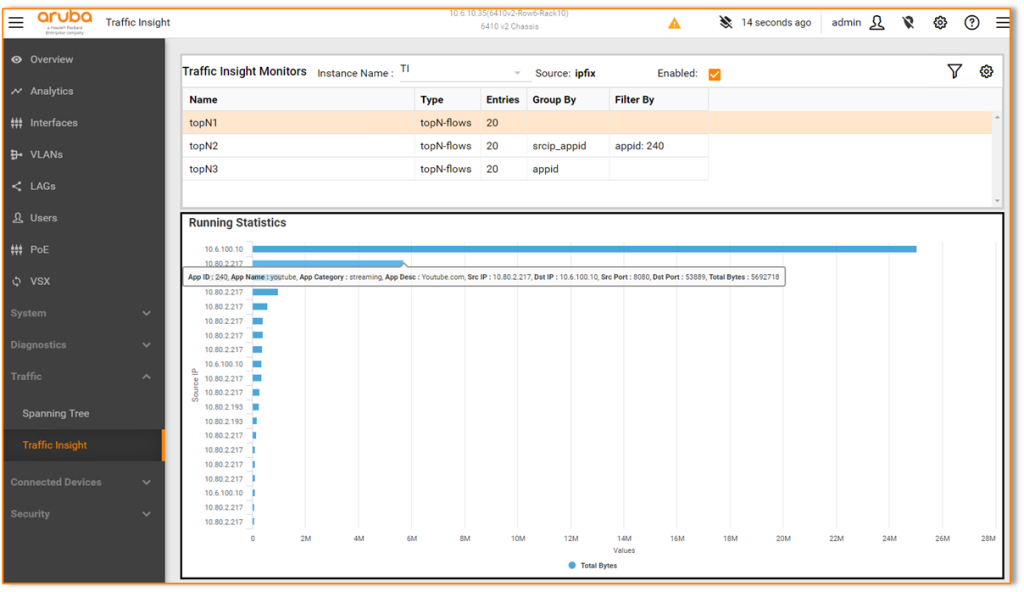
switch(config-ti)# monitor topN1 type topN-flows entries 20
switch(config-ti)# monitor topN3 type topN-flows entries 20 group-by appid
switch(config-ti)# monitor topN2 type topN-flows entries 20 group-by srcip_appid filter-by appid 240
switch(config-ti)# monitor app type application-flows
switch(config-ti)# monitor dns type dns-average-latencyTraffic Insight 구성시 모니터링 항목은 최대 5개까지만 설정할 수 있으며, app과 dns는 각각 1개씩만 설정 가능합니다.
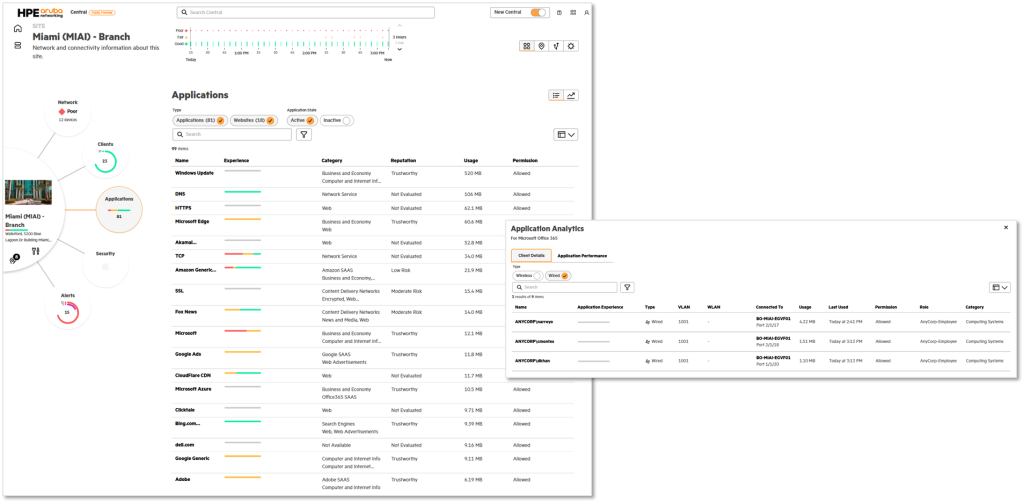
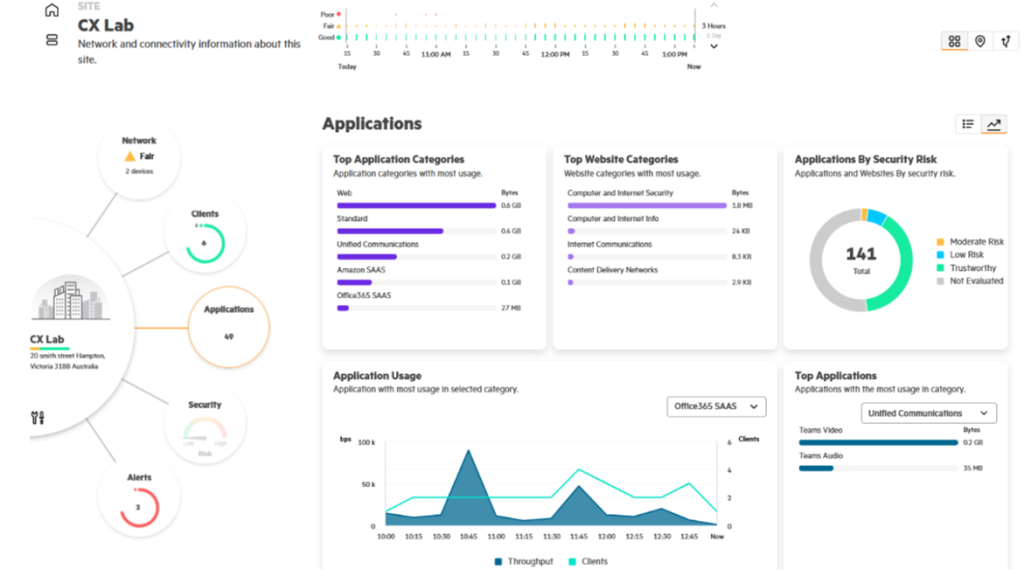
위와 같은 명령어를 실행하면, 아래와 같이 스위치의 Web UI에서 모니터링 정보를 확인할 수 있습니다.
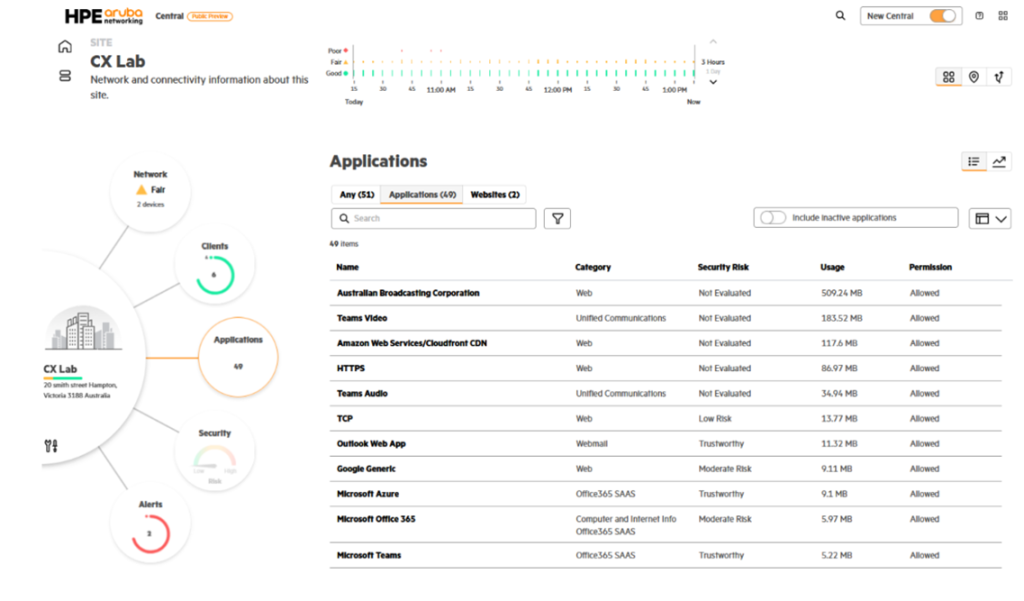
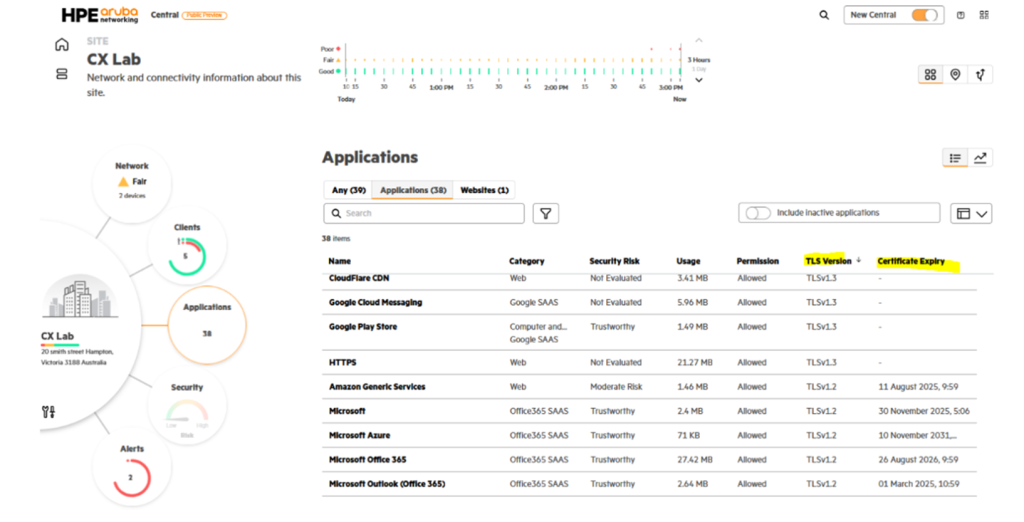
그리고 이러한 정보는 New Central(CNX)에서도 확인할 수 있습니다.
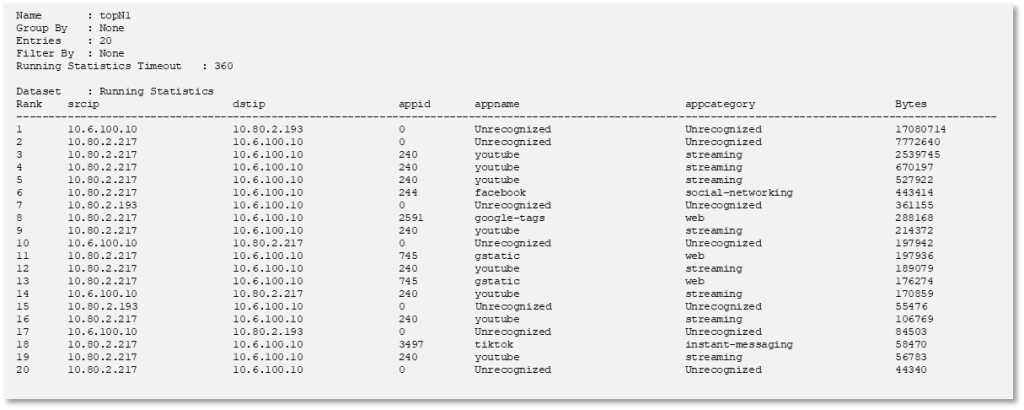
CLI에서도 show traffic-insight TI1 monitor-type topN-flows topN1 app-details 명령어를 통해 확인할 수 있습니다.
서두에 얘기한 것처럼 인프라의 복잡성이 높아지는 만큼 보안의 사각지대도 넓어지기 마련입니다.
이러한 사각지대를 최소화하고 관리자가 더 많은 가시성을 확보하는 것만이 보안을 강화하는 길입니다.
뿐만 아니라, 가시성을 확보하고 개선하는 일은 보안을 강화하는 일 뿐만 아니라 트러블슈팅도 용이하게 합니다.
즉, 현대 네트워크는 트래픽의 감시와 트래픽 내의 애플리케이션을 판별하는 일은 매우 중요합니다.
기존의 외부와 내부 트래픽에 대해서만 감시하던 방식에서 벗어나 제로트러스트 환경에서는 내부에서 발생되는 트래픽 역시도 감시가 필요하고 어떻게 동작하는지 이해할 필요가 있습니다.
별도의 솔루션을 추가 구축할 필요없이 AOS-CX 스위치의 기능만으로 옵저버빌리티를 구성해보세요.